
Advanced Search: Build a Custom Dashboard
In the fields below, search for indicators by location, topics, population, classification, subgroup, or comparison. No fields are required, but we suggest selecting a location or two to start. In the additional search options section, select options to group and order search results. To learn more about how to customize a dashboard, see our help center.
Visit the Indicator List Page to see the full list of indicators and locations available on the site.
Search Results:
Indicator Gauge Icon Legend
Legend Colors
Red is bad, green is good, blue is not statistically different/neutral.
Compared to Distribution
 the value is in the best half of communities.
 the value is in the 2nd worst quarter of communities.
 the value is in the worst quarter of communities.
Compared to Target
 meets target;
  does not meet target.
Compared to a Single Value
 lower than the comparison value;
 higher than the comparison value;
 not statistically different from comparison value.
Trend

 non-significant change over time;
 significant change over time;
  no change over time.
Compared to Prior Value
 higher than the previous measurement period;
 lower than the previous measurement period;
 no statistically different change from previous measurement period.
Health / Immunizations & Infectious Diseases
Health / Immunizations & Infectious Diseases
County: Mendocino
Value
Compared to:
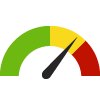
County: Mendocino Age-Adjusted Death Rate due to Influenza and Pneumonia
County: Mendocino Age-Adjusted Death Rate due to Influenza and Pneumonia
12.1
Deaths per 100,000 population
(2019-2021)
Compared to:

CA Counties
The distribution is based on data from 57 California counties.
CA Value
(11.5)
The regional value is compared to the California state value.
US Value
(13.0 in 2020)
The regional value is compared to the national value. The source for the national value is Centers for Disease Control and Prevention
Prior Value
(14.2)
Prior Value compares a measured value with the previously measured value. Confidence intervals were taken into account in determining the direction of the comparison.
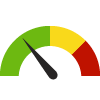
County: Mendocino Cervical Cancer Incidence Rate
County: Mendocino Cervical Cancer Incidence Rate
8.5
Cases per 100,000 females
(2016-2020)
Compared to:
CA Counties
The distribution is based on data from 40 California counties.
U.S. Counties
The distribution is based on data from 696 U.S. counties and county equivalents.
CA Value
(7.3)
The regional value is compared to the California state value.
US Value
(7.5)
The regional value is compared to the national value.
Prior Value
(9.7)
Prior Value compares a measured value with the previously measured value. Confidence intervals were taken into account in determining the direction of the comparison.
Trend
This comparison measures the indicator’s values over multiple time periods.<br>The Mann-Kendall Test for Statistical Significance is used to evaluate the trend<br>over 4 to 10 periods of measure, subject to data availability and comparability.
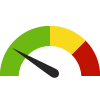
County: Mendocino Chlamydia Incidence Rate
County: Mendocino Chlamydia Incidence Rate
409.7
Cases per 100,000 population
(2021)
Compared to:

CA Counties
The distribution is based on data from 58 California counties.
CA Value
(484.7)
The regional value is compared to the California state value.
US Value
(495.5)
The regional value is compared to the national value. The source for the national value is National Center for HIV/AIDS, Viral Hepatitis, STD, and TB Prevention
Prior Value
(430.9)
Prior Value compares a measured value with the previously measured value. Confidence intervals were not taken into account in determining the direction of the comparison.
Trend
This comparison measures the indicator’s values over multiple time periods.<br>The Mann-Kendall Test for Statistical Significance is used to evaluate the trend<br>over 4 to 10 periods of measure, subject to data availability and comparability.
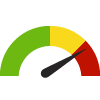
County: Mendocino Congenital Syphilis Incidence Rate
County: Mendocino Congenital Syphilis Incidence Rate
113.5
Cases per 100,000 live births
(2020)
Compared to:

CA Counties
The distribution is based on data from 58 California counties.
CA Value
(114.9)
The regional value is compared to the California state value.
Prior Value
(0.0)
Prior Value compares a measured value with the previously measured value. Confidence intervals were not taken into account in determining the direction of the comparison.
Trend
This comparison measures the indicator’s values over multiple time periods.<br>The Mann-Kendall Test for Statistical Significance is used to evaluate the trend<br>over 4 to 10 periods of measure, subject to data availability and comparability.
HP 2030 Target
(33.9)
County: Mendocino COVID-19 Daily Average Case-Fatality Rate
County: Mendocino COVID-19 Daily Average Case-Fatality Rate
0.0
Deaths per 100 cases
(Mar 3, 2023)
Compared to:

CA Counties
(Feb 3, 2023)
The distribution is based on data from 56 California counties.
U.S. Counties
(Mar 25, 2022)
The distribution is based on data from 2,811 U.S. counties and county equivalents.
CA Value
(1.0)
The regional value is compared to the California state value.
US Value
(1.7)
The regional value is compared to the national value.
Prior Value
(4.2)
Prior Value compares a measured value with the previously measured value. Confidence intervals were not taken into account in determining the direction of the comparison.
Trend
This comparison measures the indicator’s values over multiple time periods.<br>The Mann-Kendall Test for Statistical Significance is used to evaluate the trend<br>over 4 to 10 periods of measure, subject to data availability and comparability.
County: Mendocino COVID-19 Daily Average Incidence Rate
County: Mendocino COVID-19 Daily Average Incidence Rate
4.21
Cases per 100,000 population
(Mar 3, 2023)
Compared to:
CA Counties
The distribution is based on data from 58 California counties.
U.S. Counties
The distribution is based on data from 3,142 U.S. counties and county equivalents.
CA Value
(6.23)
The regional value is compared to the California state value.
US Value
(10.97)
The regional value is compared to the national value.
Prior Value
(3.74)
Prior Value compares a measured value with the previously measured value. Confidence intervals were not taken into account in determining the direction of the comparison.
Trend
This comparison measures the indicator’s values over multiple time periods.<br>The Mann-Kendall Test for Statistical Significance is used to evaluate the trend<br>over 4 to 10 periods of measure, subject to data availability and comparability.
County: Mendocino Death Rate Among Persons with Diagnosed HIV Infection
County: Mendocino Death Rate Among Persons with Diagnosed HIV Infection
1.1
Deaths per 100,000 population
(2022)
Compared to:
CA Counties
The distribution is based on data from 58 California counties.
CA Value
(5.4)
The regional value is compared to the California state value.
Prior Value
(6.8)
Prior Value compares a measured value with the previously measured value. Confidence intervals were not taken into account in determining the direction of the comparison.
Trend
This comparison measures the indicator’s values over multiple time periods.<br>The Mann-Kendall Test for Statistical Significance is used to evaluate the trend<br>over 4 to 10 periods of measure, subject to data availability and comparability.
County: Mendocino Flu Vaccinations: Medicare Population
County: Mendocino Flu Vaccinations: Medicare Population
35.0%
(2022)
Compared to:

CA Counties
The distribution is based on data from 58 California counties.
U.S. Counties
The distribution is based on data from 3,129 U.S. counties and county equivalents.
CA Value
(48.0%)
The regional value is compared to the California state value.
US Value
(50.0%)
The regional value is compared to the national value.
Prior Value
(33.0%)
Prior Value compares a measured value with the previously measured value. Confidence intervals were not taken into account in determining the direction of the comparison.
Trend
This comparison measures the indicator’s values over multiple time periods.<br>The Mann-Kendall Test for Statistical Significance is used to evaluate the trend<br>over 4 to 10 periods of measure, subject to data availability and comparability.
County: Mendocino Gonorrhea Incidence Rate
County: Mendocino Gonorrhea Incidence Rate
244.5
Cases per 100,000 population
(2021)
Compared to:

CA Counties
The distribution is based on data from 58 California counties.
CA Value
(230.9)
The regional value is compared to the California state value.
US Value
(214.0)
The regional value is compared to the national value. The source for the national value is National Center for HIV/AIDS, Viral Hepatitis, STD, and TB Prevention
Prior Value
(169.2)
Prior Value compares a measured value with the previously measured value. Confidence intervals were not taken into account in determining the direction of the comparison.
Trend
This comparison measures the indicator’s values over multiple time periods.<br>The Mann-Kendall Test for Statistical Significance is used to evaluate the trend<br>over 4 to 10 periods of measure, subject to data availability and comparability.
County: Mendocino HIV Diagnosis Rate
County: Mendocino HIV Diagnosis Rate
3.4
Cases per 100,000 population
(2022)
Compared to:
CA Counties
The distribution is based on data from 58 California counties.
CA Value
(12.2)
The regional value is compared to the California state value.
Prior Value
(4.5)
Prior Value compares a measured value with the previously measured value. Confidence intervals were not taken into account in determining the direction of the comparison.
Trend
This comparison measures the indicator’s values over multiple time periods.<br>The Mann-Kendall Test for Statistical Significance is used to evaluate the trend<br>over 4 to 10 periods of measure, subject to data availability and comparability.
County: Mendocino HIV/AIDS Prevalence Rate: 13+
County: Mendocino HIV/AIDS Prevalence Rate: 13+
235.2
Cases per 100,000 population
(2018-2020)
Compared to:


CA Value
(414.1)
The regional value is compared to the California state value.
Prior Value
(236.3)
Prior Value compares a measured value with the previously measured value. Confidence intervals were taken into account in determining the direction of the comparison.
Trend
This comparison measures the indicator’s values over multiple time periods.<br>The Mann-Kendall Test for Statistical Significance is used to evaluate the trend<br>over 4 to 10 periods of measure, subject to data availability and comparability.
County: Mendocino Kindergartners with Required Immunizations
County: Mendocino Kindergartners with Required Immunizations
88.8%
(2021-2022)
Compared to:
CA Counties
The distribution is based on data from 56 California counties.
CA Value
(92.8%)
The regional value is compared to the California state value.
Prior Value
(87.3%)
Prior Value compares a measured value with the previously measured value. Confidence intervals were not taken into account in determining the direction of the comparison.
Trend
This comparison measures the indicator’s values over multiple time periods.<br>The Mann-Kendall Test for Statistical Significance is used to evaluate the trend<br>over 4 to 10 periods of measure, subject to data availability and comparability.
County: Mendocino Overcrowded Households
County: Mendocino Overcrowded Households
4.9%
(2018-2022)
Compared to:
CA Counties
The distribution is based on data from 58 California counties.
CA Value
(8.2%)
The regional value is compared to the California state value.
US Value
(3.4%)
The regional value is compared to the national value.
Trend
This comparison measures the indicator’s values over multiple time periods.<br>The Mann-Kendall Test for Statistical Significance is used to evaluate the trend<br>over 4 to 10 periods of measure, subject to data availability and comparability.
County: Mendocino Persons Fully Vaccinated Against COVID-19
County: Mendocino Persons Fully Vaccinated Against COVID-19
69.9%
(May 10, 2023)
Compared to:
CA Counties
The distribution is based on data from 50 California counties.
U.S. Counties
The distribution is based on data from 3,125 U.S. counties and county equivalents.
Prior Value
(69.8%)
Prior Value compares a measured value with the previously measured value. Confidence intervals were not taken into account in determining the direction of the comparison.
Trend
This comparison measures the indicator’s values over multiple time periods.<br>The Mann-Kendall Test for Statistical Significance is used to evaluate the trend<br>over 4 to 10 periods of measure, subject to data availability and comparability.
County: Mendocino Persons Living and Diagnosed with HIV who are in Care
County: Mendocino Persons Living and Diagnosed with HIV who are in Care
79.5%
(2022)
Compared to:


CA Counties
The distribution is based on data from 56 California counties.
CA Value
(73.7%)
The regional value is compared to the California state value.
Prior Value
(80.2%)
Prior Value compares a measured value with the previously measured value. Confidence intervals were not taken into account in determining the direction of the comparison.
Trend
This comparison measures the indicator’s values over multiple time periods.<br>The Mann-Kendall Test for Statistical Significance is used to evaluate the trend<br>over 4 to 10 periods of measure, subject to data availability and comparability.
County: Mendocino Persons Living with HIV Rate
County: Mendocino Persons Living with HIV Rate
199.2
Cases per 100,000 population
(2022)
Compared to:

CA Value
(355.6)
The regional value is compared to the California state value.
Prior Value
(138.5)
Prior Value compares a measured value with the previously measured value. Confidence intervals were not taken into account in determining the direction of the comparison.
Trend
This comparison measures the indicator’s values over multiple time periods.<br>The Mann-Kendall Test for Statistical Significance is used to evaluate the trend<br>over 4 to 10 periods of measure, subject to data availability and comparability.
County: Mendocino Pneumonia Vaccinations: Medicare Population
County: Mendocino Pneumonia Vaccinations: Medicare Population
5.0%
(2022)
Compared to:

CA Counties
The distribution is based on data from 58 California counties.
U.S. Counties
The distribution is based on data from 3,129 U.S. counties and county equivalents.
CA Value
(8.0%)
The regional value is compared to the California state value.
US Value
(8.0%)
The regional value is compared to the national value.
Prior Value
(3.0%)
Prior Value compares a measured value with the previously measured value. Confidence intervals were not taken into account in determining the direction of the comparison.
Trend
This comparison measures the indicator’s values over multiple time periods.<br>The Mann-Kendall Test for Statistical Significance is used to evaluate the trend<br>over 4 to 10 periods of measure, subject to data availability and comparability.
County: Mendocino Syphilis Incidence Rate
County: Mendocino Syphilis Incidence Rate
17.6
Cases per 100,000 population
(2021)
Compared to:
CA Counties
The distribution is based on data from 58 California counties.
CA Value
(22.3)
The regional value is compared to the California state value.
US Value
(16.2)
The regional value is compared to the national value. The source for the national value is National Center for HIV/AIDS, Viral Hepatitis, STD, and TB Prevention
Prior Value
(8.0)
Prior Value compares a measured value with the previously measured value. Confidence intervals were not taken into account in determining the direction of the comparison.
Trend
This comparison measures the indicator’s values over multiple time periods.<br>The Mann-Kendall Test for Statistical Significance is used to evaluate the trend<br>over 4 to 10 periods of measure, subject to data availability and comparability.
