
Search for Indicators
There are complex interactions among mental health, mental illness, the high poverty rate, unemployment and homelessness. Poor mental health can both result from and contribute to other poor health and social conditions. The barriers to accessing timely and appropriate mental health services contribute to crises that local emergency departments or law enforcement must address. Community members and providers indicated that mental health services are most likely to be used when they are in the local community, financially accessible and culturally relevant.
Priority Area: Mental Health
Two-thirds (67%) of adults surveyed indicate that mental health issues are among the most important health issues facing our community (2019 Community Health Survey). Accessing mental health treatment in Mendocino County is improving (2019 RQMC Mental Health Medicaid Services) but can still be a challenge for individuals in need, partly as a result of the geographic isolation inherent in a large, rural county. The rate of suicides in Mendocino County is 29.5 per 100,000; three times the California rate of 10.5 per 100,000.
There are complex interactions among mental health, mental illness, the high poverty rate, unemployment and homelessness. Poor mental health can both result from and contribute to other poor health and social conditions. The barriers to accessing timely and appropriate mental health services contribute to crises that local emergency departments or law enforcement must address. Community members and providers indicated that mental health services are most likely to be used when they are in the local community, financially accessible and culturally relevant.
Despite an improvement in the ratio of population to mental health providers, the demand for practitioners has not matched the need for mental health services. There is currently no in-patient psychiatric facility in the county. In 2017, the voters approved Measure B, an initiative calling for a half-cent sales tax increase to fund inpatient mental health facilities. These facilities are in the planning stage.
Indicator Gauge Icon Legend
Legend Colors
Red is bad, green is good, blue is not statistically different/neutral.
Compared to Distribution
 the value is in the best half of communities.
 the value is in the 2nd worst quarter of communities.
 the value is in the worst quarter of communities.
Compared to Target
 meets target;
  does not meet target.
Compared to a Single Value
 lower than the comparison value;
 higher than the comparison value;
 not statistically different from comparison value.
Trend

 non-significant change over time;
 significant change over time;
  no change over time.
Compared to Prior Value
 higher than the previous measurement period;
 lower than the previous measurement period;
 no statistically different change from previous measurement period.
Health / Mental Health & Mental Disorders
Health / Mental Health & Mental Disorders
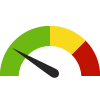
Adults Needing and Receiving Behavioral Health Care Services
Value
Compared to:
Adults Needing and Receiving Behavioral Health Care Services County: Mendocino
Adults Needing and Receiving Behavioral Health Care Services County: Mendocino
59.4%
(2021-2022)
Compared to:
CA Counties
The distribution is based on data from 58 California counties.
CA Value
(55.9%)
The regional value is compared to the California state value.
Prior Value
(62.2%)
Prior Value compares a measured value with the previously measured value. Confidence intervals were taken into account in determining the direction of the comparison.
Trend
This comparison measures the indicator’s values over multiple time periods.<br>The Mann-Kendall Test for Statistical Significance is used to evaluate the trend<br>over 4 to 10 periods of measure, subject to data availability and comparability.
Health / Mental Health & Mental Disorders
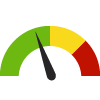
Adults with Likely Serious Psychological Distress
Value
Compared to:
Adults with Likely Serious Psychological Distress County: Mendocino
Adults with Likely Serious Psychological Distress County: Mendocino
12.9%
(2021-2022)
Compared to:

CA Counties
The distribution is based on data from 58 California counties.
CA Value
(16.7%)
The regional value is compared to the California state value.
Prior Value
(12.7%)
Prior Value compares a measured value with the previously measured value. Confidence intervals were taken into account in determining the direction of the comparison.
Trend
This comparison measures the indicator’s values over multiple time periods.<br>The Mann-Kendall Test for Statistical Significance is used to evaluate the trend<br>over 4 to 10 periods of measure, subject to data availability and comparability.
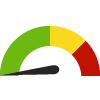
Age-Adjusted Death Rate due to Suicide County: Mendocino
Age-Adjusted Death Rate due to Suicide County: Mendocino
24.2
Deaths per 100,000 population
(2019-2021)
Compared to:

CA Counties
The distribution is based on data from 57 California counties.
CA Value
(10.3)
The regional value is compared to the California state value.
US Value
(13.5 in 2020)
The regional value is compared to the national value. The source for the national value is Centers for Disease Control and Prevention
Prior Value
(20.8)
Prior Value compares a measured value with the previously measured value. Confidence intervals were taken into account in determining the direction of the comparison.
Trend
This comparison measures the indicator’s values over multiple time periods.<br>The Mann-Kendall Test for Statistical Significance is used to evaluate the trend<br>over 4 to 10 periods of measure, subject to data availability and comparability.
HP 2030 Target
(12.8)
<div>MHMD-01: Reduce the suicide rate <strong>(LEADING HEALTH INDICATOR)</strong></div>
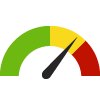
Depression: Medicare Population County: Mendocino
Depression: Medicare Population County: Mendocino
12.0%
(2022)
Compared to:
CA Counties
The distribution is based on data from 58 California counties.
U.S. Counties
The distribution is based on data from 3,129 U.S. counties and county equivalents.
CA Value
(14.0%)
The regional value is compared to the California state value.
US Value
(16.0%)
The regional value is compared to the national value.
Prior Value
(12.0%)
Prior Value compares a measured value with the previously measured value. Confidence intervals were not taken into account in determining the direction of the comparison.
Trend
This comparison measures the indicator’s values over multiple time periods.<br>The Mann-Kendall Test for Statistical Significance is used to evaluate the trend<br>over 4 to 10 periods of measure, subject to data availability and comparability.
Poor Mental Health: 14+ Days County: Mendocino
Poor Mental Health: 14+ Days County: Mendocino
15.7%
(2021)
Compared to:
CA Counties
The distribution is based on data from 58 California counties.
U.S. Counties
The distribution is based on data from 3,074 U.S. counties and county equivalents.
US Value
(14.7%)
The regional value is compared to the national value.
Health / Tobacco Use
Adults who Smoke County: Mendocino
Adults who Smoke County: Mendocino
7.5%
(2021-2022)
Compared to:
CA Counties
The distribution is based on data from 58 California counties.
CA Value
(6.1%)
The regional value is compared to the California state value.
US Value
(14.0% in 2022)
The regional value is compared to the national value. The source for the national value is Behavioral Risk Factor Surveillance System
Prior Value
(7.5%)
Prior Value compares a measured value with the previously measured value. Confidence intervals were taken into account in determining the direction of the comparison.
Trend
This comparison measures the indicator’s values over multiple time periods.<br>The Mann-Kendall Test for Statistical Significance is used to evaluate the trend<br>over 4 to 10 periods of measure, subject to data availability and comparability.
HP 2030 Target
(6.1%)
<div>TU-02: Reduce current cigarette smoking in adults <strong>(LEADING HEALTH INDICATOR)</strong></div>
Health / Wellness & Lifestyle
Frequent Physical Distress County: Mendocino
Frequent Physical Distress County: Mendocino
13.5%
(2019)
Compared to:

CA Counties
The distribution is based on data from 58 California counties.
U.S. Counties
The distribution is based on data from 3,121 U.S. counties and county equivalents.
CA Value
(11.3%)
The regional value is compared to the California state value.
US Value
(12.0%)
The regional value is compared to the national value.
Prior Value
(14.7%)
Prior Value compares a measured value with the previously measured value. Confidence intervals were taken into account in determining the direction of the comparison.
