
Search for Indicators
Key Health Indicators from the 2019 Community Health Needs Assessment
Summary of Key Health Indicators from the 2019 Community Health Needs Assessment (CHNA). These Health Indicators are important data tools for assessing the health of Mendocino County.
Indicator Gauge Icon Legend
Legend Colors
Red is bad, green is good, blue is not statistically different/neutral.
Compared to Distribution
 the value is in the best half of communities.
 the value is in the 2nd worst quarter of communities.
 the value is in the worst quarter of communities.
Compared to Target
 meets target;
  does not meet target.
Compared to a Single Value
 lower than the comparison value;
 higher than the comparison value;
 not statistically different from comparison value.
Trend

 non-significant change over time;
 significant change over time;
  no change over time.
Compared to Prior Value
 higher than the previous measurement period;
 lower than the previous measurement period;
 no statistically different change from previous measurement period.
Health / Alcohol & Drug Use
Health / Alcohol & Drug Use
County: Mendocino
Value
Compared to:
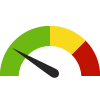
County: Mendocino Age-Adjusted Annual Opioid Prescription Rate
County: Mendocino Age-Adjusted Annual Opioid Prescription Rate
435.0
Prescriptions per 1,000 residents
(2022)
Compared to:
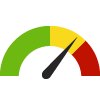

CA Counties
The distribution is based on data from 58 California counties.
CA Value
(291.0)
The regional value is compared to the California state value.
Prior Value
(498.9)
Prior Value compares a measured value with the previously measured value. Confidence intervals were taken into account in determining the direction of the comparison.
Trend
This comparison measures the indicator’s values over multiple time periods.<br>The Mann-Kendall Test for Statistical Significance is used to evaluate the trend<br>over 4 to 10 periods of measure, subject to data availability and comparability.
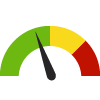
County: Mendocino Age-Adjusted Death Rate due to All Opioid Overdose
County: Mendocino Age-Adjusted Death Rate due to All Opioid Overdose
54.9
Rate per 100,000 residents
(2022)
Compared to:
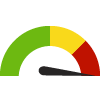


CA Counties
The distribution is based on data from 58 California counties.
CA Value
(18.7)
The regional value is compared to the California state value.
Prior Value
(54.7)
Prior Value compares a measured value with the previously measured value. Confidence intervals were not taken into account in determining the direction of the comparison.
Trend
This comparison measures the indicator’s values over multiple time periods.<br>The Mann-Kendall Test for Statistical Significance is used to evaluate the trend<br>over 4 to 10 periods of measure, subject to data availability and comparability.
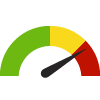
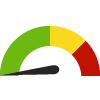
County: Mendocino Age-Adjusted Death Rate due to Drug Use
County: Mendocino Age-Adjusted Death Rate due to Drug Use
56.2
Deaths per 100,000 population
(2019-2021)
Compared to:
CA Counties
The distribution is based on data from 57 California counties.
CA Value
(21.4)
The regional value is compared to the California state value.
Prior Value
(42.0)
Prior Value compares a measured value with the previously measured value. Confidence intervals were taken into account in determining the direction of the comparison.
Trend
This comparison measures the indicator’s values over multiple time periods.<br>The Mann-Kendall Test for Statistical Significance is used to evaluate the trend<br>over 4 to 10 periods of measure, subject to data availability and comparability.
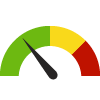
County: Mendocino Age-Adjusted Death Rate due to Heroin Overdose
County: Mendocino Age-Adjusted Death Rate due to Heroin Overdose
8.6
Deaths per 100,000 population
(2019)
Compared to:
CA Counties
(2018)
The distribution is based on data from 58 California counties.
CA Value
(2.4)
The regional value is compared to the California state value.
Prior Value
(3.4)
Prior Value compares a measured value with the previously measured value. Confidence intervals were not taken into account in determining the direction of the comparison.
Trend
This comparison measures the indicator’s values over multiple time periods.<br>The Mann-Kendall Test for Statistical Significance is used to evaluate the trend<br>over 4 to 10 periods of measure, subject to data availability and comparability.
HP 2030 Target
(4.2)
County: Mendocino Age-Adjusted Death Rate due to Prescription Opioid Overdose
County: Mendocino Age-Adjusted Death Rate due to Prescription Opioid Overdose
54.9
Rate per 100,000 residents
(2022)
Compared to:
CA Counties
The distribution is based on data from 58 California counties.
CA Value
(18.1)
The regional value is compared to the California state value.
Prior Value
(53.2)
Prior Value compares a measured value with the previously measured value. Confidence intervals were not taken into account in determining the direction of the comparison.
Trend
This comparison measures the indicator’s values over multiple time periods.<br>The Mann-Kendall Test for Statistical Significance is used to evaluate the trend<br>over 4 to 10 periods of measure, subject to data availability and comparability.
49.9
Rate per 100,000 residents
(2022)
Compared to:
CA Counties
The distribution is based on data from 58 California counties.
CA Value
(16.7)
The regional value is compared to the California state value.
Prior Value
(49.1)
Prior Value compares a measured value with the previously measured value. Confidence intervals were not taken into account in determining the direction of the comparison.
Trend
This comparison measures the indicator’s values over multiple time periods.<br>The Mann-Kendall Test for Statistical Significance is used to evaluate the trend<br>over 4 to 10 periods of measure, subject to data availability and comparability.
HP 2030 Target
(8.9)
<div>IVP-22: Reduce overdose deaths involving synthetic opioids other than methadone</div>
County: Mendocino Age-Adjusted ED Visit Rate due to All Drug Overdose
County: Mendocino Age-Adjusted ED Visit Rate due to All Drug Overdose
195.9
Rate per 100,000 residents
(2022)
Compared to:

CA Counties
The distribution is based on data from 58 California counties.
CA Value
(143.7)
The regional value is compared to the California state value.
Prior Value
(246.7)
Prior Value compares a measured value with the previously measured value. Confidence intervals were not taken into account in determining the direction of the comparison.
Trend
This comparison measures the indicator’s values over multiple time periods.<br>The Mann-Kendall Test for Statistical Significance is used to evaluate the trend<br>over 4 to 10 periods of measure, subject to data availability and comparability.
County: Mendocino Age-Adjusted ED Visit Rate due to Heroin Overdose
County: Mendocino Age-Adjusted ED Visit Rate due to Heroin Overdose
4.3
Rate per 100,000 residents
(2022)
Compared to:
CA Counties
The distribution is based on data from 58 California counties.
CA Value
(3.6)
The regional value is compared to the California state value.
Prior Value
(10.2)
Prior Value compares a measured value with the previously measured value. Confidence intervals were not taken into account in determining the direction of the comparison.
Trend
This comparison measures the indicator’s values over multiple time periods.<br>The Mann-Kendall Test for Statistical Significance is used to evaluate the trend<br>over 4 to 10 periods of measure, subject to data availability and comparability.
County: Mendocino Age-Adjusted ED Visit Rate due to Opioid Overdose (excluding Heroin)
County: Mendocino Age-Adjusted ED Visit Rate due to Opioid Overdose (excluding Heroin)
88.2
Rate per 100,000 residents
(2022)
Compared to:
CA Counties
The distribution is based on data from 58 California counties.
CA Value
(54.9)
The regional value is compared to the California state value.
Prior Value
(25.3)
Prior Value compares a measured value with the previously measured value. Confidence intervals were not taken into account in determining the direction of the comparison.
Trend
This comparison measures the indicator’s values over multiple time periods.<br>The Mann-Kendall Test for Statistical Significance is used to evaluate the trend<br>over 4 to 10 periods of measure, subject to data availability and comparability.
County: Mendocino Age-Adjusted Hospitalization Rate due to All Drug Overdose
County: Mendocino Age-Adjusted Hospitalization Rate due to All Drug Overdose
50.2
Rate per 100,000 residents
(2022)
Compared to:
CA Counties
The distribution is based on data from 58 California counties.
CA Value
(48.3)
The regional value is compared to the California state value.
Prior Value
(77.6)
Prior Value compares a measured value with the previously measured value. Confidence intervals were not taken into account in determining the direction of the comparison.
Trend
This comparison measures the indicator’s values over multiple time periods.<br>The Mann-Kendall Test for Statistical Significance is used to evaluate the trend<br>over 4 to 10 periods of measure, subject to data availability and comparability.
County: Mendocino Age-Adjusted Hospitalization Rate due to Heroin Overdose
County: Mendocino Age-Adjusted Hospitalization Rate due to Heroin Overdose
0.0
Rate per 100,000 residents
(2022)
Compared to:
CA Counties
The distribution is based on data from 58 California counties.
CA Value
(0.7)
The regional value is compared to the California state value.
Prior Value
(5.6)
Prior Value compares a measured value with the previously measured value. Confidence intervals were not taken into account in determining the direction of the comparison.
Trend
This comparison measures the indicator’s values over multiple time periods.<br>The Mann-Kendall Test for Statistical Significance is used to evaluate the trend<br>over 4 to 10 periods of measure, subject to data availability and comparability.
12.9
Rate per 100,000 residents
(2022)
Compared to:
CA Counties
The distribution is based on data from 58 California counties.
CA Value
(12.1)
The regional value is compared to the California state value.
Prior Value
(25.3)
Prior Value compares a measured value with the previously measured value. Confidence intervals were not taken into account in determining the direction of the comparison.
Trend
This comparison measures the indicator’s values over multiple time periods.<br>The Mann-Kendall Test for Statistical Significance is used to evaluate the trend<br>over 4 to 10 periods of measure, subject to data availability and comparability.
3.0
Per 100,000 population
(2022)
Compared to:
CA Counties
The distribution is based on data from 58 California counties.
CA Value
(1.2)
The regional value is compared to the California state value.
Prior Value
(3.6)
Prior Value compares a measured value with the previously measured value. Confidence intervals were taken into account in determining the direction of the comparison.
Trend
This comparison measures the indicator’s values over multiple time periods.<br>The Mann-Kendall Test for Statistical Significance is used to evaluate the trend<br>over 4 to 10 periods of measure, subject to data availability and comparability.
County: Mendocino Quarterly Opioid Prescription Rate
County: Mendocino Quarterly Opioid Prescription Rate
483.2
Prescriptions per 10,000 population
(Q3 2022)
Compared to:
CA Counties
(Q2 2022)
The distribution is based on data from 58 California counties.
Prior Value
(491.0)
Prior Value compares a measured value with the previously measured value. Confidence intervals were not taken into account in determining the direction of the comparison.
Trend
This comparison measures the indicator’s values over multiple time periods.<br>The Mann-Kendall Test for Statistical Significance is used to evaluate the trend<br>over 4 to 10 periods of measure, subject to data availability and comparability.
County: Mendocino Opioid Prescription Patients
County: Mendocino Opioid Prescription Patients
3.7%
(Q3 2022)
Compared to:
CA Counties
(Q2 2022)
The distribution is based on data from 58 California counties.
Prior Value
(3.8%)
Prior Value compares a measured value with the previously measured value. Confidence intervals were not taken into account in determining the direction of the comparison.
Trend
This comparison measures the indicator’s values over multiple time periods.<br>The Mann-Kendall Test for Statistical Significance is used to evaluate the trend<br>over 4 to 10 periods of measure, subject to data availability and comparability.
11.8
Residents on >90 MMEs of Opioids per 1,000 residents
(2022)
Compared to:
CA Counties
The distribution is based on data from 58 California counties.
CA Value
(6.3)
The regional value is compared to the California state value.
Prior Value
(14.2)
Prior Value compares a measured value with the previously measured value. Confidence intervals were taken into account in determining the direction of the comparison.
Trend
This comparison measures the indicator’s values over multiple time periods.<br>The Mann-Kendall Test for Statistical Significance is used to evaluate the trend<br>over 4 to 10 periods of measure, subject to data availability and comparability.
County: Mendocino Teens who Use Alcohol: 11th Graders
County: Mendocino Teens who Use Alcohol: 11th Graders
34.0%
(2017-2019)
Compared to:
CA Value
(16.0%)
The regional value is compared to the California state value.
Prior Value
(31.0%)
Prior Value compares a measured value with the previously measured value. Confidence intervals were not taken into account in determining the direction of the comparison.
Trend
This comparison measures the indicator’s values over multiple time periods.<br>The Mann-Kendall Test for Statistical Significance is used to evaluate the trend<br>over 4 to 10 periods of measure, subject to data availability and comparability.
County: Mendocino Teens who Use Marijuana: 11th Graders
County: Mendocino Teens who Use Marijuana: 11th Graders
22.0%
(2017-2019)
Compared to:
CA Value
(16.0%)
The regional value is compared to the California state value.
Prior Value
(27.0%)
Prior Value compares a measured value with the previously measured value. Confidence intervals were not taken into account in determining the direction of the comparison.
Trend
This comparison measures the indicator’s values over multiple time periods.<br>The Mann-Kendall Test for Statistical Significance is used to evaluate the trend<br>over 4 to 10 periods of measure, subject to data availability and comparability.
Health / Family Planning
Health / Family Planning
County: Mendocino
Value
Compared to:
County: Mendocino Teen Birth Rate: 15-19
County: Mendocino Teen Birth Rate: 15-19
17.6
Live births per 1,000 females aged 15-19
(2019-2021)
Compared to:
CA Counties
The distribution is based on data from 55 California counties.
CA Value
(10.3)
The regional value is compared to the California state value.
US Value
(15.2)
The regional value is compared to the national value. The source for the national value is Centers for Disease Control and Prevention, National Center for Health Statistics
Prior Value
(16.8)
Prior Value compares a measured value with the previously measured value. Confidence intervals were taken into account in determining the direction of the comparison.
Trend
This comparison measures the indicator’s values over multiple time periods.<br>The Mann-Kendall Test for Statistical Significance is used to evaluate the trend<br>over 4 to 10 periods of measure, subject to data availability and comparability.
Health / Maternal, Fetal & Infant Health
Health / Maternal, Fetal & Infant Health
County: Mendocino
Value
Compared to:
County: Mendocino Babies with Low Birthweight
County: Mendocino Babies with Low Birthweight
6.7%
(2019-2021)
Compared to:

CA Counties
The distribution is based on data from 56 California counties.
CA Value
(7.1%)
The regional value is compared to the California state value.
US Value
(8.5% in 2021)
The regional value is compared to the national value. The source for the national value is Centers for Disease Control and Prevention
Prior Value
(6.5%)
Prior Value compares a measured value with the previously measured value. Confidence intervals were taken into account in determining the direction of the comparison.
Trend
This comparison measures the indicator’s values over multiple time periods.<br>The Mann-Kendall Test for Statistical Significance is used to evaluate the trend<br>over 4 to 10 periods of measure, subject to data availability and comparability.
Health / Mental Health & Mental Disorders
Health / Mental Health & Mental Disorders
County: Mendocino
Value
Compared to:
County: Mendocino Adults Needing and Receiving Behavioral Health Care Services
County: Mendocino Adults Needing and Receiving Behavioral Health Care Services
59.4%
(2021-2022)
Compared to:
CA Counties
The distribution is based on data from 58 California counties.
CA Value
(55.9%)
The regional value is compared to the California state value.
Prior Value
(62.2%)
Prior Value compares a measured value with the previously measured value. Confidence intervals were taken into account in determining the direction of the comparison.
Trend
This comparison measures the indicator’s values over multiple time periods.<br>The Mann-Kendall Test for Statistical Significance is used to evaluate the trend<br>over 4 to 10 periods of measure, subject to data availability and comparability.
County: Mendocino Adults with Likely Serious Psychological Distress
County: Mendocino Adults with Likely Serious Psychological Distress
12.9%
(2021-2022)
Compared to:
CA Counties
The distribution is based on data from 58 California counties.
CA Value
(16.7%)
The regional value is compared to the California state value.
Prior Value
(12.7%)
Prior Value compares a measured value with the previously measured value. Confidence intervals were taken into account in determining the direction of the comparison.
Trend
This comparison measures the indicator’s values over multiple time periods.<br>The Mann-Kendall Test for Statistical Significance is used to evaluate the trend<br>over 4 to 10 periods of measure, subject to data availability and comparability.
County: Mendocino Age-Adjusted Death Rate due to Suicide
County: Mendocino Age-Adjusted Death Rate due to Suicide
24.2
Deaths per 100,000 population
(2019-2021)
Compared to:
CA Counties
The distribution is based on data from 57 California counties.
CA Value
(10.3)
The regional value is compared to the California state value.
US Value
(13.5 in 2020)
The regional value is compared to the national value. The source for the national value is Centers for Disease Control and Prevention
Prior Value
(20.8)
Prior Value compares a measured value with the previously measured value. Confidence intervals were taken into account in determining the direction of the comparison.
Trend
This comparison measures the indicator’s values over multiple time periods.<br>The Mann-Kendall Test for Statistical Significance is used to evaluate the trend<br>over 4 to 10 periods of measure, subject to data availability and comparability.
HP 2030 Target
(12.8)
<div>MHMD-01: Reduce the suicide rate <strong>(LEADING HEALTH INDICATOR)</strong></div>
County: Mendocino Depression: Medicare Population
County: Mendocino Depression: Medicare Population
12.0%
(2022)
Compared to:
CA Counties
The distribution is based on data from 58 California counties.
U.S. Counties
The distribution is based on data from 3,129 U.S. counties and county equivalents.
CA Value
(14.0%)
The regional value is compared to the California state value.
US Value
(16.0%)
The regional value is compared to the national value.
Prior Value
(12.0%)
Prior Value compares a measured value with the previously measured value. Confidence intervals were not taken into account in determining the direction of the comparison.
Trend
This comparison measures the indicator’s values over multiple time periods.<br>The Mann-Kendall Test for Statistical Significance is used to evaluate the trend<br>over 4 to 10 periods of measure, subject to data availability and comparability.
County: Mendocino Frequent Mental Distress
County: Mendocino Frequent Mental Distress
14.5%
(2019)
Compared to:
CA Counties
The distribution is based on data from 58 California counties.
U.S. Counties
The distribution is based on data from 3,121 U.S. counties and county equivalents.
CA Value
(12.0%)
The regional value is compared to the California state value.
US Value
(14.0%)
The regional value is compared to the national value.
Prior Value
(14.9%)
Prior Value compares a measured value with the previously measured value. Confidence intervals were taken into account in determining the direction of the comparison.
Health / Sexually Transmitted Infections
Health / Sexually Transmitted Infections
County: Mendocino
Value
Compared to:
County: Mendocino Congenital Syphilis Incidence Rate
County: Mendocino Congenital Syphilis Incidence Rate
113.5
Cases per 100,000 live births
(2020)
Compared to:
CA Counties
The distribution is based on data from 58 California counties.
CA Value
(114.9)
The regional value is compared to the California state value.
Prior Value
(0.0)
Prior Value compares a measured value with the previously measured value. Confidence intervals were not taken into account in determining the direction of the comparison.
Trend
This comparison measures the indicator’s values over multiple time periods.<br>The Mann-Kendall Test for Statistical Significance is used to evaluate the trend<br>over 4 to 10 periods of measure, subject to data availability and comparability.
HP 2030 Target
(33.9)
County: Mendocino Death Rate Among Persons with Diagnosed HIV Infection
County: Mendocino Death Rate Among Persons with Diagnosed HIV Infection
1.1
Deaths per 100,000 population
(2022)
Compared to:
CA Counties
The distribution is based on data from 58 California counties.
CA Value
(5.4)
The regional value is compared to the California state value.
Prior Value
(6.8)
Prior Value compares a measured value with the previously measured value. Confidence intervals were not taken into account in determining the direction of the comparison.
Trend
This comparison measures the indicator’s values over multiple time periods.<br>The Mann-Kendall Test for Statistical Significance is used to evaluate the trend<br>over 4 to 10 periods of measure, subject to data availability and comparability.
County: Mendocino Gonorrhea Incidence Rate
County: Mendocino Gonorrhea Incidence Rate
244.5
Cases per 100,000 population
(2021)
Compared to:
CA Counties
The distribution is based on data from 58 California counties.
CA Value
(230.9)
The regional value is compared to the California state value.
US Value
(214.0)
The regional value is compared to the national value. The source for the national value is National Center for HIV/AIDS, Viral Hepatitis, STD, and TB Prevention
Prior Value
(169.2)
Prior Value compares a measured value with the previously measured value. Confidence intervals were not taken into account in determining the direction of the comparison.
Trend
This comparison measures the indicator’s values over multiple time periods.<br>The Mann-Kendall Test for Statistical Significance is used to evaluate the trend<br>over 4 to 10 periods of measure, subject to data availability and comparability.
Health / Tobacco Use
Health / Tobacco Use
County: Mendocino
Value
Compared to:
County: Mendocino Adults who Smoke
County: Mendocino Adults who Smoke
7.5%
(2021-2022)
Compared to:
CA Counties
The distribution is based on data from 58 California counties.
CA Value
(6.1%)
The regional value is compared to the California state value.
US Value
(14.0% in 2022)
The regional value is compared to the national value. The source for the national value is Behavioral Risk Factor Surveillance System
Prior Value
(7.5%)
Prior Value compares a measured value with the previously measured value. Confidence intervals were taken into account in determining the direction of the comparison.
Trend
This comparison measures the indicator’s values over multiple time periods.<br>The Mann-Kendall Test for Statistical Significance is used to evaluate the trend<br>over 4 to 10 periods of measure, subject to data availability and comparability.
HP 2030 Target
(6.1%)
<div>TU-02: Reduce current cigarette smoking in adults <strong>(LEADING HEALTH INDICATOR)</strong></div>
County: Mendocino Teens who Smoke: 11th Graders
County: Mendocino Teens who Smoke: 11th Graders
7.0%
(2017-2019)
Compared to:
CA Value
(2.0%)
The regional value is compared to the California state value.
Prior Value
(3.0%)
Prior Value compares a measured value with the previously measured value. Confidence intervals were not taken into account in determining the direction of the comparison.
Trend
This comparison measures the indicator’s values over multiple time periods.<br>The Mann-Kendall Test for Statistical Significance is used to evaluate the trend<br>over 4 to 10 periods of measure, subject to data availability and comparability.
Health / Wellness & Lifestyle
Health / Wellness & Lifestyle
County: Mendocino
Value
Compared to:
County: Mendocino Self-Reported General Health Assessment: Good or Better
County: Mendocino Self-Reported General Health Assessment: Good or Better
80.3%
(2022)
Compared to:


CA Counties
The distribution is based on data from 58 California counties.
CA Value
(86.0%)
The regional value is compared to the California state value.
Prior Value
(87.9%)
Prior Value compares a measured value with the previously measured value. Confidence intervals were taken into account in determining the direction of the comparison.
Trend
This comparison measures the indicator’s values over multiple time periods.<br>The Mann-Kendall Test for Statistical Significance is used to evaluate the trend<br>over 4 to 10 periods of measure, subject to data availability and comparability.
Community / Crime & Crime Prevention
Community / Crime & Crime Prevention
County: Mendocino
Value
Compared to:
County: Mendocino Adult Arrest Rate
County: Mendocino Adult Arrest Rate
26.8
Arrests per 1,000 population 18+
(2022)
Compared to:
CA Counties
The distribution is based on data from 58 California counties.
CA Value
(25.1)
The regional value is compared to the California state value.
Prior Value
(43.8)
Prior Value compares a measured value with the previously measured value. Confidence intervals were not taken into account in determining the direction of the comparison.
Trend
This comparison measures the indicator’s values over multiple time periods.<br>The Mann-Kendall Test for Statistical Significance is used to evaluate the trend<br>over 4 to 10 periods of measure, subject to data availability and comparability.
Community / Public Safety
Community / Public Safety
County: Mendocino
Value
Compared to:
County: Mendocino Alcohol-Impaired Driving Deaths
County: Mendocino Alcohol-Impaired Driving Deaths
31.6%
Percent of driving deaths with alcohol involvement
(2017-2021)
Compared to:
CA Counties
The distribution is based on data from 58 California counties.
U.S. Counties
The distribution is based on data from 3,116 U.S. counties and county equivalents.
CA Value
(26.7%)
The regional value is compared to the California state value.
US Value
(26.3%)
The regional value is compared to the national value.
Prior Value
(34.3%)
Prior Value compares a measured value with the previously measured value. Confidence intervals were taken into account in determining the direction of the comparison.
Trend
This comparison measures the indicator’s values over multiple time periods.<br>The Mann-Kendall Test for Statistical Significance is used to evaluate the trend<br>over 4 to 10 periods of measure, subject to data availability and comparability.
Community / Social Environment
Community / Social Environment
County: Mendocino
Value
Compared to:
County: Mendocino Substantiated Child Abuse Rate
County: Mendocino Substantiated Child Abuse Rate
17.5
Cases per 1,000 children
(2022)
Compared to:
CA Value
(6.1)
The regional value is compared to the California state value.
US Value
(8.2 in 2021)
The regional value is compared to the national value. The source for the national value is Children's Bureau
Prior Value
(14.2)
Prior Value compares a measured value with the previously measured value. Confidence intervals were not taken into account in determining the direction of the comparison.
Trend
This comparison measures the indicator’s values over multiple time periods.<br>The Mann-Kendall Test for Statistical Significance is used to evaluate the trend<br>over 4 to 10 periods of measure, subject to data availability and comparability.
HP 2030 Target
(8.7)
Economy / Food Insecurity
Economy / Food Insecurity
County: Mendocino
Value
Compared to:
County: Mendocino Students Eligible for the Free Lunch Program
County: Mendocino Students Eligible for the Free Lunch Program
64.9%
(2022-2023)
Compared to:
CA Counties
The distribution is based on data from 58 California counties.
U.S. Counties
The distribution is based on data from 2,710 U.S. counties and county equivalents.
CA Value
(52.6%)
The regional value is compared to the California state value.
US Value
(42.8%)
The regional value is compared to the national value.
Prior Value
(65.1%)
Prior Value compares a measured value with the previously measured value. Confidence intervals were not taken into account in determining the direction of the comparison.
Trend
This comparison measures the indicator’s values over multiple time periods.<br>The Mann-Kendall Test for Statistical Significance is used to evaluate the trend<br>over 4 to 10 periods of measure, subject to data availability and comparability.
Economy / Homelessness
Economy / Homelessness
County: Mendocino
Value
Compared to:
County: Mendocino Sheltered Homeless
County: Mendocino Sheltered Homeless
270
Persons
(2022)
Compared to:
Prior Value
(318)
Prior Value compares a measured value with the previously measured value. Confidence intervals were not taken into account in determining the direction of the comparison.
Trend
This comparison measures the indicator’s values over multiple time periods.<br>The Mann-Kendall Test for Statistical Significance is used to evaluate the trend<br>over 4 to 10 periods of measure, subject to data availability and comparability.
County: Mendocino Total Homeless Population
County: Mendocino Total Homeless Population
830
Persons
(2022)
Compared to:
Prior Value
(318)
Prior Value compares a measured value with the previously measured value. Confidence intervals were not taken into account in determining the direction of the comparison.
Trend
This comparison measures the indicator’s values over multiple time periods.<br>The Mann-Kendall Test for Statistical Significance is used to evaluate the trend<br>over 4 to 10 periods of measure, subject to data availability and comparability.
County: Mendocino Unsheltered Homeless
County: Mendocino Unsheltered Homeless
560
Persons
(2022)
Compared to:
Prior Value
Prior Value compares a measured value with the previously measured value. Confidence intervals were not taken into account in determining the direction of the comparison.
Trend
This comparison measures the indicator’s values over multiple time periods.<br>The Mann-Kendall Test for Statistical Significance is used to evaluate the trend<br>over 4 to 10 periods of measure, subject to data availability and comparability.
Economy / Housing & Homes
Economy / Housing & Homes
County: Mendocino
Value
Compared to:
County: Mendocino Homeownership
County: Mendocino Homeownership
50.9%
(2018-2022)
Compared to:
CA Counties
The distribution is based on data from 58 California counties.
U.S. Counties
The distribution is based on data from 3,133 U.S. counties and county equivalents.
CA Value
(51.4%)
The regional value is compared to the California state value.
US Value
(57.8%)
The regional value is compared to the national value.
Trend
This comparison measures the indicator’s values over multiple time periods.<br>The Mann-Kendall Test for Statistical Significance is used to evaluate the trend<br>over 4 to 10 periods of measure, subject to data availability and comparability.
County: Mendocino Severe Housing Problems
County: Mendocino Severe Housing Problems
23.7%
(2016-2020)
Compared to:
CA Counties
The distribution is based on data from 58 California counties.
U.S. Counties
The distribution is based on data from 3,141 U.S. counties and county equivalents.
CA Value
(25.7%)
The regional value is compared to the California state value.
US Value
(16.7%)
The regional value is compared to the national value.
Prior Value
(25.0%)
Prior Value compares a measured value with the previously measured value. Confidence intervals were taken into account in determining the direction of the comparison.
Trend
This comparison measures the indicator’s values over multiple time periods.<br>The Mann-Kendall Test for Statistical Significance is used to evaluate the trend<br>over 4 to 10 periods of measure, subject to data availability and comparability.
Economy / Poverty
Economy / Poverty
County: Mendocino
Value
Compared to:
County: Mendocino Children Living Below Poverty Level
County: Mendocino Children Living Below Poverty Level
20.6%
(2018-2022)
Compared to:
CA Counties
The distribution is based on data from 58 California counties.
U.S. Counties
The distribution is based on data from 3,132 U.S. counties and county equivalents.
CA Value
(15.6%)
The regional value is compared to the California state value.
US Value
(16.7%)
The regional value is compared to the national value.
Trend
This comparison measures the indicator’s values over multiple time periods.<br>The Mann-Kendall Test for Statistical Significance is used to evaluate the trend<br>over 4 to 10 periods of measure, subject to data availability and comparability.
County: Mendocino Youth not in School or Working
County: Mendocino Youth not in School or Working
2.1%
(2018-2022)
Compared to:
CA Counties
The distribution is based on data from 58 California counties.
U.S. Counties
The distribution is based on data from 3,130 U.S. counties and county equivalents.
CA Value
(1.5%)
The regional value is compared to the California state value.
US Value
(1.8%)
The regional value is compared to the national value.
Trend
This comparison measures the indicator’s values over multiple time periods.<br>The Mann-Kendall Test for Statistical Significance is used to evaluate the trend<br>over 4 to 10 periods of measure, subject to data availability and comparability.
Environmental Health / Built Environment
Environmental Health / Built Environment
County: Mendocino
Value
Compared to:
County: Mendocino Liquor Store Density
County: Mendocino Liquor Store Density
8.8
Stores per 100,000 population
(2021)
Compared to:
CA Counties
The distribution is based on data from 44 California counties.
U.S. Counties
The distribution is based on data from 1,477 U.S. counties and county equivalents.
CA Value
(11.0)
The regional value is compared to the California state value.
US Value
(10.7)
The regional value is compared to the national value.
Prior Value
(8.8)
Prior Value compares a measured value with the previously measured value. Confidence intervals were not taken into account in determining the direction of the comparison.
Trend
This comparison measures the indicator’s values over multiple time periods.<br>The Mann-Kendall Test for Statistical Significance is used to evaluate the trend<br>over 4 to 10 periods of measure, subject to data availability and comparability.
