The 2024 Health Equity Index (formerly SocioNeeds Index), created by Conduent Healthy Communities Institute, is a measure of socioeconomic need that is correlated with poor health outcomes. The index is part of Conduent's SocioNeeds Index® Suite, which provides analytics around social determinants of health to advance equitable outcomes for a range of topics.
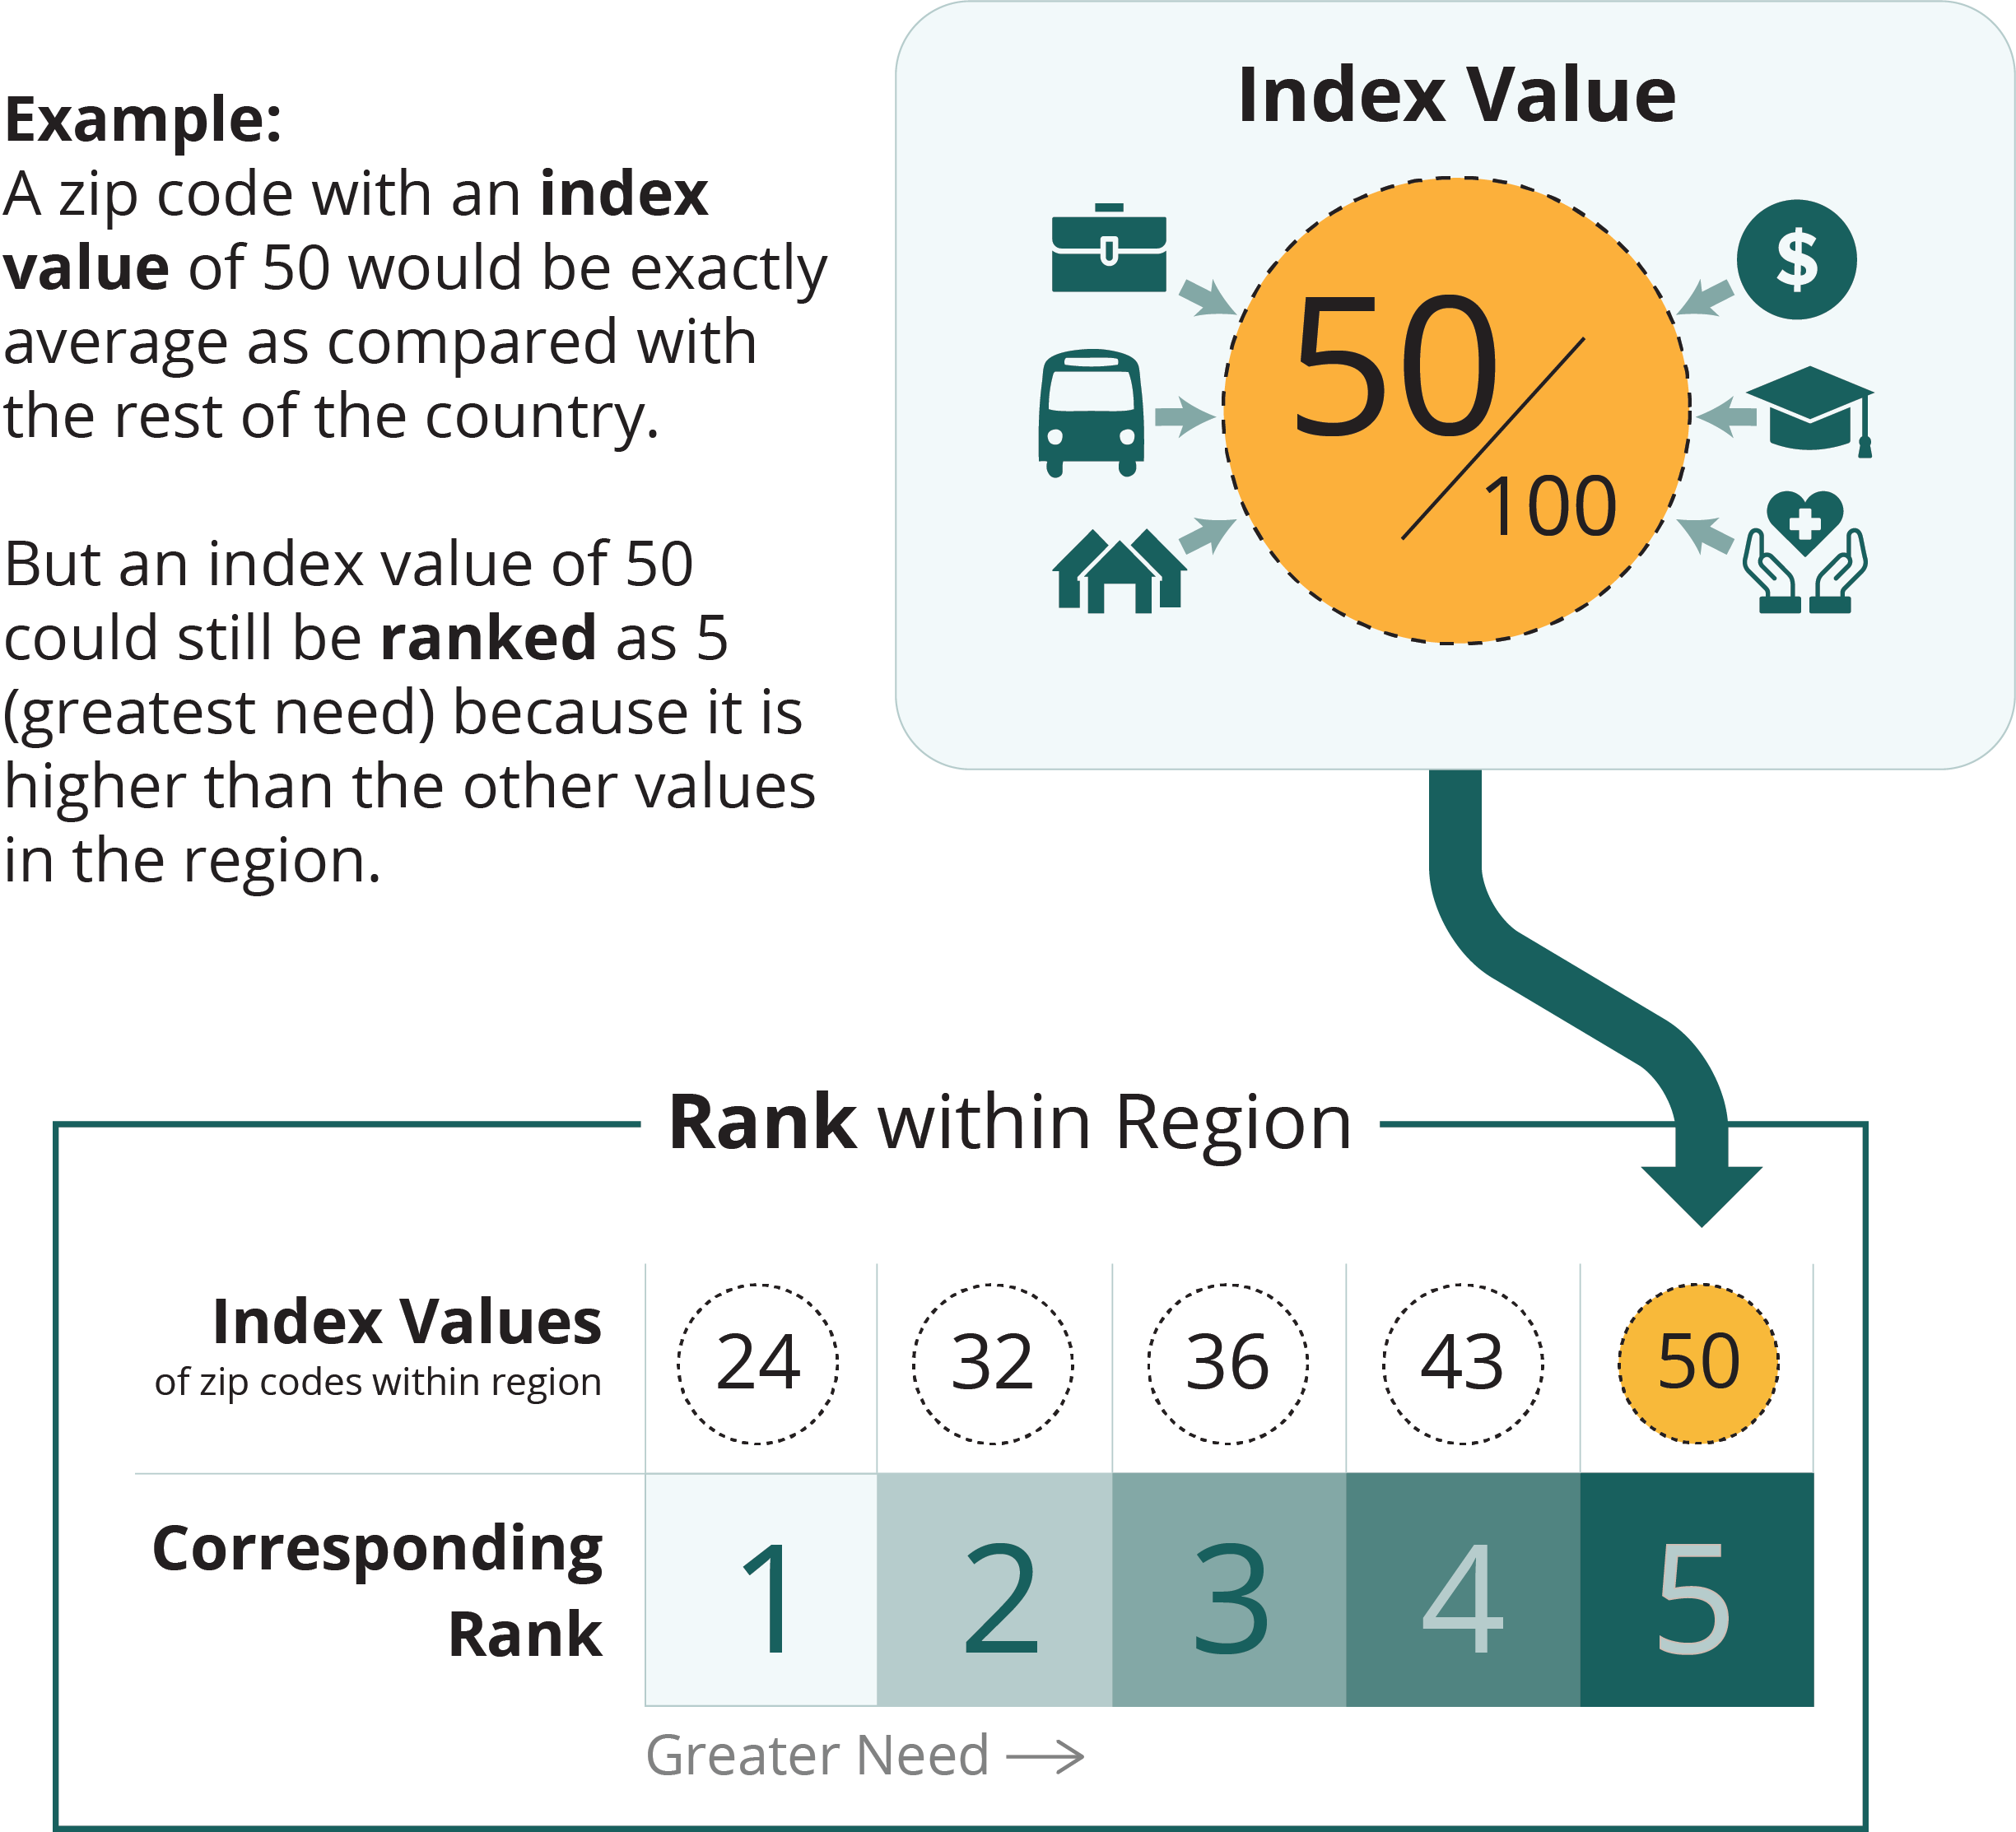
All zip codes, counties, and county equivalents in the United States are given an index value from 0 (low need) to 100 (high need). To help you find the areas of highest need in your community, the selected locations are ranked from 1 (low need) to 5 (high need) based on their index value relative to similar locations within the region.

map legend
greater need
1
2
3
4
5


| Zip Codesort column | Indexsort column | Ranksort column | Pop.sort column | Countysort column |
|---|---|---|---|---|
| 95454 | 99.6 | 5 | 2,323 | Mendocino |
| 95427 | 98.8 | 5 | 446 | Mendocino |
| 95585 | 98.3 | 5 | 385 | Mendocino |
| 95466 | 97.7 | 5 | 1,174 | Mendocino |
| 95587 | 96.7 | 5 | 372 | Mendocino |
| 95449 | 94.8 | 5 | 1,545 | Mendocino |
| 95432 | 94.0 | 5 | 388 | Mendocino |
| 95410 | 91.0 | 5 | 882 | Mendocino |
| 95490 | 87.7 | 4 | 13,875 | Mendocino |
| 95456 | 85.9 | 4 | 1,236 | Mendocino |
| 95468 | 84.7 | 4 | 1,361 | Mendocino |
| 95445 | 82.5 | 4 | 2,484 | Mendocino |
| 95428 | 81.1 | 4 | 2,928 | Mendocino |
| 95482 | 79.6 | 4 | 32,564 | Mendocino |
| 95459 | 79.2 | 4 | 521 | Mendocino |
| 95437 | 77.2 | 4 | 14,333 | Mendocino |
| 95415 | 73.9 | 3 | 1,399 | Mendocino |
| 95420 | 64.2 | 3 | 320 | Mendocino |
| 95470 | 53.9 | 2 | 5,951 | Mendocino |
| 95460 | 49.3 | 2 | 2,014 | Mendocino |
| 95469 | 36.8 | 1 | 1,995 | Mendocino |
Data Source
The Health Equity Index is calculated by Conduent Healthy Communities Institute using data from Claritas Pop-Facts®, 2024 and Claritas Consumer Profiles, 2023.
Technical Note
Index values are not comparable across measurement periods. Index values and rankings are specific to a measurement period, showing the relative ranking of a location in comparison to other similar locations at that time.