
Indicator Gauge Icon Legend
Legend Colors
Red is bad, green is good, blue is not statistically different/neutral.
Compared to Distribution
 the value is in the best half of communities.
 the value is in the 2nd worst quarter of communities.
 the value is in the worst quarter of communities.
Compared to Target
 meets target;
  does not meet target.
Compared to a Single Value
 lower than the comparison value;
 higher than the comparison value;
 not statistically different from comparison value.
Trend

 non-significant change over time;
 significant change over time;
  no change over time.
Compared to Prior Value
 higher than the previous measurement period;
 lower than the previous measurement period;
 no statistically different change from previous measurement period.
 Significantly better than the overall value
 Significantly worse than the overall value
 No significant difference with the overall value
 No data on significance available
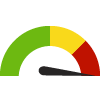
People Delayed or had Difficulty Obtaining Care
Measurement Period: 2021-2022
This indicator is archived and is no longer being updated. Click to learn more
This indicator shows the percentage of people who report having delayed or not received other medical care they felt they needed.
Why is this important?
Utilizing appropriate clinical and preventative services in a timely fashion can have important implications on the progression and treatment of many diseases. Individuals who receive services in a timely manner have greater opportunity to prevent disease or detect disease during earlier, treatable stages. A delay of necessary care can lead to an increased risk of complications.
The Healthy People 2030 national health target is to reduce the proportion of persons who are unable to obtain or delayed in obtaining necessary medical care to 5.9 percent.
21.7%
Source:
California Health Interview Survey
Measurement period: 2021-2022
Maintained by: Conduent Healthy Communities Institute
Last update: January 2024
Measurement period: 2021-2022
Maintained by: Conduent Healthy Communities Institute
Last update: January 2024


Graph Selections
No significant difference with the overall value

Data Source
- California Health Interview Survey
Note: This source uses Zip Code Tabulation Areas (ZCTAs) for its Zip Code data. Learn more
Maintained By: Conduent Healthy Communities Institute (Methodology)
Filed under: Health / Health Care Access & Quality, Clinical Care, People with Disabilities