
Advanced Search: Build a Custom Dashboard
In the fields below, search for indicators by location, topics, population, classification, subgroup, or comparison. No fields are required, but we suggest selecting a location or two to start. In the additional search options section, select options to group and order search results. To learn more about how to customize a dashboard, see our help center.
Visit the Indicator List Page to see the full list of indicators and locations available on the site.
Search Results:
Indicator Gauge Icon Legend
Legend Colors
Red is bad, green is good, blue is not statistically different/neutral.
Compared to Distribution
 the value is in the best half of communities.
 the value is in the 2nd worst quarter of communities.
 the value is in the worst quarter of communities.
Compared to Target
 meets target;
  does not meet target.
Compared to a Single Value
 lower than the comparison value;
 higher than the comparison value;
 not statistically different from comparison value.
Trend

 non-significant change over time;
 significant change over time;
  no change over time.
Compared to Prior Value
 higher than the previous measurement period;
 lower than the previous measurement period;
 no statistically different change from previous measurement period.
Health / Health Care Access & Quality
Health / Health Care Access & Quality
County: Mendocino
Value
Compared to:
County: Mendocino Adults Delayed or had Difficulty Obtaining Care
County: Mendocino Adults Delayed or had Difficulty Obtaining Care
24.2%
(2019-2020)
Compared to:


CA Value
(22.0%)
The regional value is compared to the California state value.
Prior Value
(26.3%)
Prior Value compares a measured value with the previously measured value. Confidence intervals were taken into account in determining the direction of the comparison.
Trend
This comparison measures the indicator’s values over multiple time periods.<br>The Mann-Kendall Test for Statistical Significance is used to evaluate the trend<br>over 4 to 10 periods of measure, subject to data availability and comparability.
County: Mendocino Adults Needing and Receiving Behavioral Health Care Services
County: Mendocino Adults Needing and Receiving Behavioral Health Care Services
59.4%
(2021-2022)
Compared to:
CA Counties
The distribution is based on data from 58 California counties.
CA Value
(55.9%)
The regional value is compared to the California state value.
Prior Value
(62.2%)
Prior Value compares a measured value with the previously measured value. Confidence intervals were taken into account in determining the direction of the comparison.
Trend
This comparison measures the indicator’s values over multiple time periods.<br>The Mann-Kendall Test for Statistical Significance is used to evaluate the trend<br>over 4 to 10 periods of measure, subject to data availability and comparability.
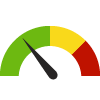
County: Mendocino Adults who have had a Routine Checkup
County: Mendocino Adults who have had a Routine Checkup
64.9%
(2021)
Compared to:


CA Counties
The distribution is based on data from 58 California counties.
U.S. Counties
The distribution is based on data from 3,074 U.S. counties and county equivalents.
US Value
(73.6%)
The regional value is compared to the national value.
County: Mendocino Adults who Visited a Dentist
County: Mendocino Adults who Visited a Dentist
60.4%
(2020)
Compared to:

CA Counties
The distribution is based on data from 58 California counties.
U.S. Counties
The distribution is based on data from 3,141 U.S. counties and county equivalents.
US Value
(64.8%)
The regional value is compared to the national value.
County: Mendocino Adults with Health Insurance: 18-64
County: Mendocino Adults with Health Insurance: 18-64
91.4%
(2020-2022)
Compared to:
CA Counties
The distribution is based on data from 58 California counties.
CA Value
(91.2%)
The regional value is compared to the California state value.
Prior Value
(94.9%)
Prior Value compares a measured value with the previously measured value. Confidence intervals were taken into account in determining the direction of the comparison.
Trend
This comparison measures the indicator’s values over multiple time periods.<br>The Mann-Kendall Test for Statistical Significance is used to evaluate the trend<br>over 4 to 10 periods of measure, subject to data availability and comparability.
County: Mendocino Adults with Private Health Insurance
County: Mendocino Adults with Private Health Insurance
58.3%
(2022)
Compared to:
CA Counties
The distribution is based on data from 58 California counties.
CA Value
(65.4%)
The regional value is compared to the California state value.
Prior Value
(67.8%)
Prior Value compares a measured value with the previously measured value. Confidence intervals were taken into account in determining the direction of the comparison.
Trend
This comparison measures the indicator’s values over multiple time periods.<br>The Mann-Kendall Test for Statistical Significance is used to evaluate the trend<br>over 4 to 10 periods of measure, subject to data availability and comparability.
County: Mendocino Adults without Health Insurance
County: Mendocino Adults without Health Insurance
10.1%
(2021)
Compared to:
CA Counties
The distribution is based on data from 58 California counties.
U.S. Counties
The distribution is based on data from 3,074 U.S. counties and county equivalents.
US Value
(10.8%)
The regional value is compared to the national value.
County: Mendocino Children and Teens Delayed or had Difficulty Obtaining Care
County: Mendocino Children and Teens Delayed or had Difficulty Obtaining Care
6.5%
(2019-2020)
Compared to:
CA Value
(8.7%)
The regional value is compared to the California state value.
Prior Value
(8.2%)
Prior Value compares a measured value with the previously measured value. Confidence intervals were taken into account in determining the direction of the comparison.
Trend
This comparison measures the indicator’s values over multiple time periods.<br>The Mann-Kendall Test for Statistical Significance is used to evaluate the trend<br>over 4 to 10 periods of measure, subject to data availability and comparability.
County: Mendocino Children who Visited a Dentist
County: Mendocino Children who Visited a Dentist
87.4%
(2019-2020)
Compared to:
CA Value
(89.5%)
The regional value is compared to the California state value.
Prior Value
(82.6%)
Prior Value compares a measured value with the previously measured value. Confidence intervals were taken into account in determining the direction of the comparison.
County: Mendocino Children with Health Insurance
County: Mendocino Children with Health Insurance
94.8%
(2022)
Compared to:
CA Counties
The distribution is based on data from 42 California counties.
U.S. Counties
The distribution is based on data from 828 U.S. counties and county equivalents.
CA Value
(96.8%)
The regional value is compared to the California state value.
US Value
(94.9%)
The regional value is compared to the national value.
Prior Value
(85.2%)
Prior Value compares a measured value with the previously measured value. Confidence intervals were taken into account in determining the direction of the comparison.
Trend
This comparison measures the indicator’s values over multiple time periods.<br>The Mann-Kendall Test for Statistical Significance is used to evaluate the trend<br>over 4 to 10 periods of measure, subject to data availability and comparability.
County: Mendocino Dentist Rate
County: Mendocino Dentist Rate
80
Dentists per 100,000 population
(2022)
Compared to:
CA Counties
The distribution is based on data from 58 California counties.
U.S. Counties
The distribution is based on data from 3,054 U.S. counties and county equivalents.
CA Value
(93)
The regional value is compared to the California state value.
Prior Value
(79)
Prior Value compares a measured value with the previously measured value. Confidence intervals were not taken into account in determining the direction of the comparison.
Trend
This comparison measures the indicator’s values over multiple time periods.<br>The Mann-Kendall Test for Statistical Significance is used to evaluate the trend<br>over 4 to 10 periods of measure, subject to data availability and comparability.
County: Mendocino Disabled Persons with Health Insurance
County: Mendocino Disabled Persons with Health Insurance
91.1%
(2011-2012)
Compared to:
CA Counties
The distribution is based on data from 44 California counties and county groups.
CA Value
(83.2%)
The regional value is compared to the California state value.
Prior Value
(91.4%)
Prior Value compares a measured value with the previously measured value. Confidence intervals were taken into account in determining the direction of the comparison.
County: Mendocino Medicare Healthcare Costs
County: Mendocino Medicare Healthcare Costs
$7,003
Dollars per enrollee
(2015)
Compared to:


CA Value
($9,100)
The regional value is compared to the California state value.
US Value
($9,729)
The regional value is compared to the national value.
Prior Value
($6,713)
Prior Value compares a measured value with the previously measured value. Confidence intervals were not taken into account in determining the direction of the comparison.
Trend
This comparison measures the indicator’s values over multiple time periods.<br>The Mann-Kendall Test for Statistical Significance is used to evaluate the trend<br>over 4 to 10 periods of measure, subject to data availability and comparability.
County: Mendocino Mental Health Provider Rate
County: Mendocino Mental Health Provider Rate
663
Providers per 100,000 population
(2023)
Compared to:

CA Counties
The distribution is based on data from 58 California counties.
U.S. Counties
The distribution is based on data from 2,956 U.S. counties and county equivalents.
CA Value
(450)
The regional value is compared to the California state value.
Prior Value
(683)
Prior Value compares a measured value with the previously measured value. Confidence intervals were not taken into account in determining the direction of the comparison.
Trend
This comparison measures the indicator’s values over multiple time periods.<br>The Mann-Kendall Test for Statistical Significance is used to evaluate the trend<br>over 4 to 10 periods of measure, subject to data availability and comparability.
County: Mendocino Non-Physician Primary Care Provider Rate
County: Mendocino Non-Physician Primary Care Provider Rate
111
Providers per 100,000 population
(2023)
Compared to:
CA Counties
The distribution is based on data from 58 California counties.
U.S. Counties
The distribution is based on data from 3,129 U.S. counties and county equivalents.
CA Value
(87)
The regional value is compared to the California state value.
Prior Value
(105)
Prior Value compares a measured value with the previously measured value. Confidence intervals were not taken into account in determining the direction of the comparison.
Trend
This comparison measures the indicator’s values over multiple time periods.<br>The Mann-Kendall Test for Statistical Significance is used to evaluate the trend<br>over 4 to 10 periods of measure, subject to data availability and comparability.
County: Mendocino People Delayed or had Difficulty Obtaining Care
County: Mendocino People Delayed or had Difficulty Obtaining Care
21.7%
(2021-2022)
Compared to:

CA Counties
The distribution is based on data from 58 California counties.
CA Value
(16.5%)
The regional value is compared to the California state value.
Prior Value
(22.4%)
Prior Value compares a measured value with the previously measured value. Confidence intervals were taken into account in determining the direction of the comparison.
Trend
This comparison measures the indicator’s values over multiple time periods.<br>The Mann-Kendall Test for Statistical Significance is used to evaluate the trend<br>over 4 to 10 periods of measure, subject to data availability and comparability.
HP 2030 Target
(5.9%)
County: Mendocino Persons with Health Insurance
County: Mendocino Persons with Health Insurance
90.3%
(2021)
Compared to:
CA Counties
The distribution is based on data from 58 California counties.
U.S. Counties
The distribution is based on data from 3,140 U.S. counties and county equivalents.
CA Value
(91.9%)
The regional value is compared to the California state value.
Prior Value
(88.8%)
Prior Value compares a measured value with the previously measured value. Confidence intervals were taken into account in determining the direction of the comparison.
Trend
This comparison measures the indicator’s values over multiple time periods.<br>The Mann-Kendall Test for Statistical Significance is used to evaluate the trend<br>over 4 to 10 periods of measure, subject to data availability and comparability.
HP 2030 Target
(92.4%)
<div>AHS-01: Increase the proportion of people with health insurance <strong>(LEADING HEALTH INDICATOR)</strong></div>
County: Mendocino Persons with Private Health Insurance Only
County: Mendocino Persons with Private Health Insurance Only
37.3%
(2022)
Compared to:

CA Value
(53.5%)
The regional value is compared to the California state value.
US Value
(54.8%)
The regional value is compared to the national value.
Prior Value
(35.2%)
Prior Value compares a measured value with the previously measured value. Confidence intervals were not taken into account in determining the direction of the comparison.
Trend
This comparison measures the indicator’s values over multiple time periods.<br>The Mann-Kendall Test for Statistical Significance is used to evaluate the trend<br>over 4 to 10 periods of measure, subject to data availability and comparability.
County: Mendocino Persons with Public Health Insurance Only
County: Mendocino Persons with Public Health Insurance Only
41.2%
(2022)
Compared to:


CA Value
(29.8%)
The regional value is compared to the California state value.
US Value
(24.8%)
The regional value is compared to the national value.
Prior Value
(40.3%)
Prior Value compares a measured value with the previously measured value. Confidence intervals were not taken into account in determining the direction of the comparison.
Trend
This comparison measures the indicator’s values over multiple time periods.<br>The Mann-Kendall Test for Statistical Significance is used to evaluate the trend<br>over 4 to 10 periods of measure, subject to data availability and comparability.
County: Mendocino Preventable Hospital Stays: Medicare Population
County: Mendocino Preventable Hospital Stays: Medicare Population
1,823.0
Discharges per 100,000 Medicare enrollees
(2022)
Compared to:

CA Counties
The distribution is based on data from 58 California counties.
U.S. Counties
The distribution is based on data from 3,129 U.S. counties and county equivalents.
CA Value
(2,275.0)
The regional value is compared to the California state value.
US Value
(2,677.0)
The regional value is compared to the national value.
Prior Value
(1,593.0)
Prior Value compares a measured value with the previously measured value. Confidence intervals were not taken into account in determining the direction of the comparison.
Trend
This comparison measures the indicator’s values over multiple time periods.<br>The Mann-Kendall Test for Statistical Significance is used to evaluate the trend<br>over 4 to 10 periods of measure, subject to data availability and comparability.
County: Mendocino Primary Care Provider Rate
County: Mendocino Primary Care Provider Rate
78
Providers per 100,000 population
(2021)
Compared to:

CA Counties
The distribution is based on data from 57 California counties.
U.S. Counties
The distribution is based on data from 2,984 U.S. counties and county equivalents.
CA Value
(81)
The regional value is compared to the California state value.
Prior Value
(88)
Prior Value compares a measured value with the previously measured value. Confidence intervals were not taken into account in determining the direction of the comparison.
Trend
This comparison measures the indicator’s values over multiple time periods.<br>The Mann-Kendall Test for Statistical Significance is used to evaluate the trend<br>over 4 to 10 periods of measure, subject to data availability and comparability.
