
Nielsen Claritas Demographic Profile
What is the Nielsen Claritas demographic profile?
The Nielsen Claritas demographic profile is a supplemental dataset that includes 100 data elements that describe the demographic characteristics of our community at the state, county and zip code or census tract level. Nielsen Claritas annual estimates provide richer population estimates than the Census QuickFacts.
All elements will be available on the demographic dashboard. Additionally, select demographic elements can be layered over maps within each indicator page allowing users to view indicator and demographic data simultaneously.
Which demographic elements are included?
The Nielson Claritas data provide detailed demographic information on population, race/ethnicity, housing, economic, education and occupation characteristics. Base counts such as population, number of households, families, and housing units are available at the state, county and zip code or census tract level. The estimates also include counts and percentages for race, ethnicity, sex, age, language spoken at home, marital status, household income, educational attainment, and much more! A full list of demographic elements is available upon request.
Nielsen Claritas Demographics in Action
• All demographic elements are highlighted on your platform’s
demographic dashboard
• Compare zip codes and counties side-by-side
• Display values in counts and percentages
• View select demographic elements, including race/ethnicity,
age, language, education and income level, on a GIS map;
layer demographic maps over HCI’s indicator maps to view
indicator and demographic information simultaneously
• Create custom pie charts and bar graphs
• Tell your community’s story by adding charts and graphs to
custom pages on your HCI Platform, such as a priority page or
community snapshot page
• Download charts and graphs as a PDF, PNG or JPEG file that
can easily be added to reports, presentations and emails
How to Access the Claritas Data
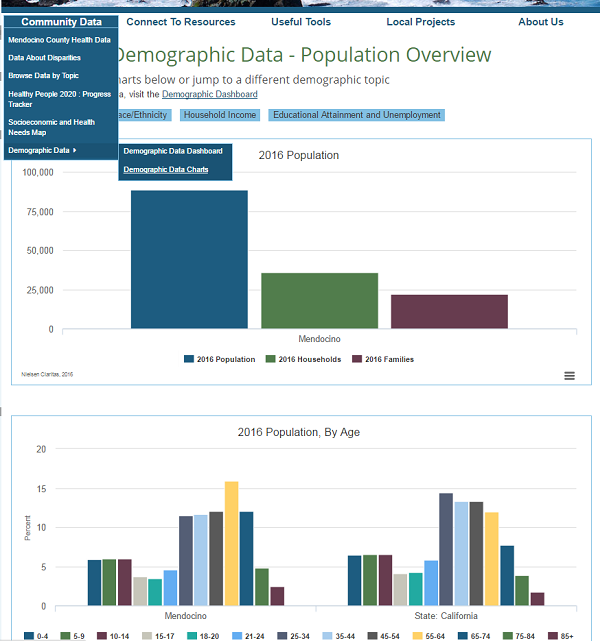
To view the Demographics data or charts scroll over “Community Data” on the Navigation Bar and highlight “Demographic Data” from the drop down menu. It has a “fly-out” to link to the Demographic Dashboard as well as the Demographic Charts.
When you have select the Demographic Charts you will be directed to the "Population Overview" page. You can drill down on specific population characteristics by clicking the "Race/Ethnicity," "Household Income," and "Educational Attainment and Unemployment" charts. All charts can be downloaded as images to use in reports and presentations by clicking on the 3 bars in the lower right of each chart.
When you have select the Demographic Charts you will be directed to the "Population Overview" page. You can drill down on specific population characteristics by clicking the "Race/Ethnicity," "Household Income," and "Educational Attainment and Unemployment" charts. All charts can be downloaded as images to use in reports and presentations by clicking on the 3 bars in the lower right of each chart.
When reviewing a chart, scroll over a section of interest to see the exact number it represents. You can remove/add back in a demographic variable from the interactive chart by clicking on it in the legend.
To review all demographic data in one central location and to access data by zip code, go to the Demographic Data Dashboard. Select Zip Code from Location Type. Select the zip code you want from Location.
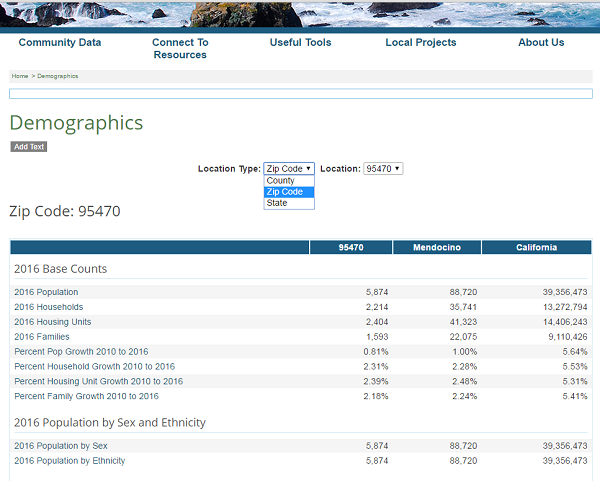
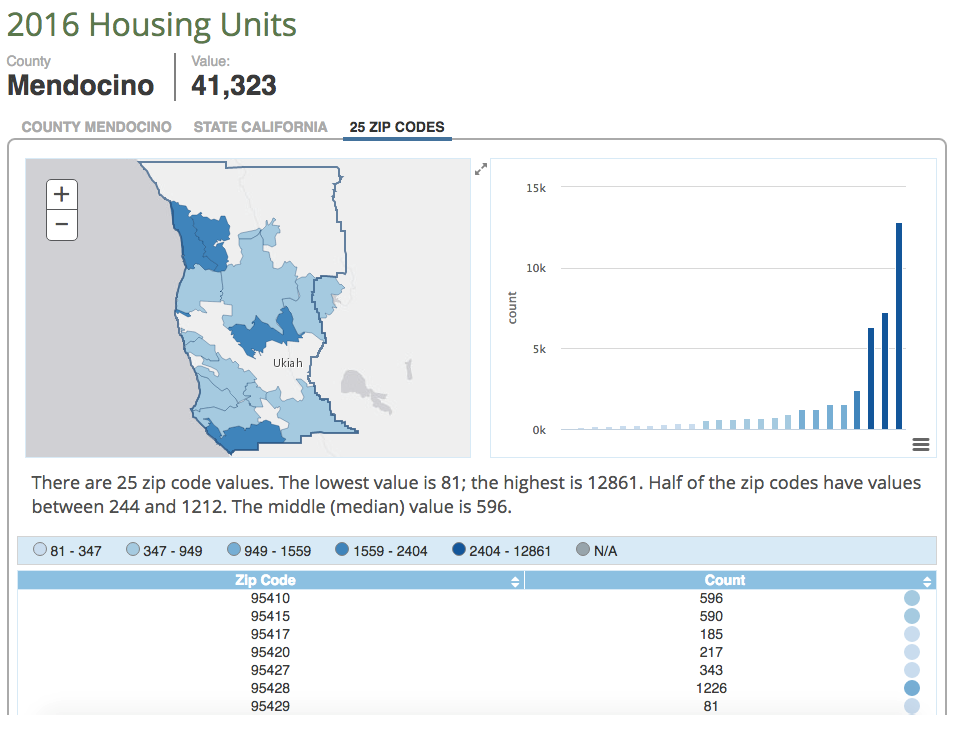
The new Dashboard coming out at the end of August, will also use the Zip Code data. The new demographics pages will compare all the zip code data for each demographic variable. Take a look at the screenshots below to get a better sense of what it will look like.

Author:
Patrice Mascolo
Resource Date:
August 3, 2016
Resource Type:
Topics:
