
Advanced Search: Build a Custom Dashboard
In the fields below, search for indicators by location, topics, population, classification, subgroup, or comparison. No fields are required, but we suggest selecting a location or two to start. In the additional search options section, select options to group and order search results. To learn more about how to customize a dashboard, see our help center.
Visit the Indicator List Page to see the full list of indicators and locations available on the site.
Search Results:
Indicator Gauge Icon Legend
Legend Colors
Red is bad, green is good, blue is not statistically different/neutral.
Compared to Distribution
 the value is in the best half of communities.
 the value is in the 2nd worst quarter of communities.
 the value is in the worst quarter of communities.
Compared to Target
 meets target;
  does not meet target.
Compared to a Single Value
 lower than the comparison value;
 higher than the comparison value;
 not statistically different from comparison value.
Trend

 non-significant change over time;
 significant change over time;
  no change over time.
Compared to Prior Value
 higher than the previous measurement period;
 lower than the previous measurement period;
 no statistically different change from previous measurement period.
Education / Educational Attainment
People 25+ with a Bachelor's Degree or Higher Census Tract: 06045011004
People 25+ with a Bachelor's Degree or Higher Census Tract: 06045011004
41.1%
(2018-2022)
Compared to:
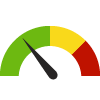

CA Census Tracts
The distribution is based on data from 9,076 California census tracts.
U.S. Census Tracts
The distribution is based on data from 82,720 U.S. census tracts.
Mendocino, CA County Value
(24.0%)
The regional value is compared to the Mendocino County value.
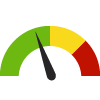
People 25+ with a Bachelor's Degree or Higher Census Tract: 06045011102
People 25+ with a Bachelor's Degree or Higher Census Tract: 06045011102
29.7%
(2018-2022)
Compared to:

CA Census Tracts
The distribution is based on data from 9,076 California census tracts.
U.S. Census Tracts
The distribution is based on data from 82,720 U.S. census tracts.
Mendocino, CA County Value
(24.0%)
The regional value is compared to the Mendocino County value.
Trend
This comparison measures the indicator’s values over multiple time periods.<br>The Mann-Kendall Test for Statistical Significance is used to evaluate the trend<br>over 4 to 10 periods of measure, subject to data availability and comparability.
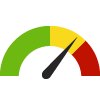
People 25+ with a Bachelor's Degree or Higher Census Tract: 06045011200
People 25+ with a Bachelor's Degree or Higher Census Tract: 06045011200
35.6%
(2018-2022)
Compared to:
CA Census Tracts
The distribution is based on data from 9,076 California census tracts.
U.S. Census Tracts
The distribution is based on data from 82,720 U.S. census tracts.
Mendocino, CA County Value
(24.0%)
The regional value is compared to the Mendocino County value.
Trend
This comparison measures the indicator’s values over multiple time periods.<br>The Mann-Kendall Test for Statistical Significance is used to evaluate the trend<br>over 4 to 10 periods of measure, subject to data availability and comparability.
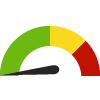
People 25+ with a Bachelor's Degree or Higher Census Tract: 06045011300
People 25+ with a Bachelor's Degree or Higher Census Tract: 06045011300
12.0%
(2018-2022)
Compared to:


CA Census Tracts
The distribution is based on data from 9,076 California census tracts.
U.S. Census Tracts
The distribution is based on data from 82,720 U.S. census tracts.
Mendocino, CA County Value
(24.0%)
The regional value is compared to the Mendocino County value.
Trend
This comparison measures the indicator’s values over multiple time periods.<br>The Mann-Kendall Test for Statistical Significance is used to evaluate the trend<br>over 4 to 10 periods of measure, subject to data availability and comparability.
People 25+ with a Bachelor's Degree or Higher Census Tract: 06045011400
People 25+ with a Bachelor's Degree or Higher Census Tract: 06045011400
33.6%
(2018-2022)
Compared to:
CA Census Tracts
The distribution is based on data from 9,076 California census tracts.
U.S. Census Tracts
The distribution is based on data from 82,720 U.S. census tracts.
Mendocino, CA County Value
(24.0%)
The regional value is compared to the Mendocino County value.
Trend
This comparison measures the indicator’s values over multiple time periods.<br>The Mann-Kendall Test for Statistical Significance is used to evaluate the trend<br>over 4 to 10 periods of measure, subject to data availability and comparability.
People 25+ with a Bachelor's Degree or Higher Census Tract: 06045011500
People 25+ with a Bachelor's Degree or Higher Census Tract: 06045011500
16.1%
(2015-2019)
Compared to:
CA Census Tracts
The distribution is based on data from 8,009 California census tracts.
U.S. Census Tracts
The distribution is based on data from 72,386 U.S. census tracts.
Mendocino, CA County Value
(24.4%)
The regional value is compared to the Mendocino County value.
Trend
This comparison measures the indicator’s values over multiple time periods.<br>The Mann-Kendall Test for Statistical Significance is used to evaluate the trend<br>over 4 to 10 periods of measure, subject to data availability and comparability.
People 25+ with a Bachelor's Degree or Higher Census Tract: 06045011501
People 25+ with a Bachelor's Degree or Higher Census Tract: 06045011501
32.7%
(2018-2022)
Compared to:
CA Census Tracts
The distribution is based on data from 9,076 California census tracts.
U.S. Census Tracts
The distribution is based on data from 82,720 U.S. census tracts.
Mendocino, CA County Value
(24.0%)
The regional value is compared to the Mendocino County value.
People 25+ with a Bachelor's Degree or Higher Census Tract: 06045011502
People 25+ with a Bachelor's Degree or Higher Census Tract: 06045011502
9.7%
(2018-2022)
Compared to:
CA Census Tracts
The distribution is based on data from 9,076 California census tracts.
U.S. Census Tracts
The distribution is based on data from 82,720 U.S. census tracts.
Mendocino, CA County Value
(24.0%)
The regional value is compared to the Mendocino County value.
People 25+ with a Bachelor's Degree or Higher Census Tract: 06045011600
People 25+ with a Bachelor's Degree or Higher Census Tract: 06045011600
13.7%
(2018-2022)
Compared to:
CA Census Tracts
The distribution is based on data from 9,076 California census tracts.
U.S. Census Tracts
The distribution is based on data from 82,720 U.S. census tracts.
Mendocino, CA County Value
(24.0%)
The regional value is compared to the Mendocino County value.
Trend
This comparison measures the indicator’s values over multiple time periods.<br>The Mann-Kendall Test for Statistical Significance is used to evaluate the trend<br>over 4 to 10 periods of measure, subject to data availability and comparability.
People 25+ with a Bachelor's Degree or Higher Census Tract: 06045011700
People 25+ with a Bachelor's Degree or Higher Census Tract: 06045011700
39.7%
(2018-2022)
Compared to:
CA Census Tracts
The distribution is based on data from 9,076 California census tracts.
U.S. Census Tracts
The distribution is based on data from 82,720 U.S. census tracts.
Mendocino, CA County Value
(24.0%)
The regional value is compared to the Mendocino County value.
Trend
This comparison measures the indicator’s values over multiple time periods.<br>The Mann-Kendall Test for Statistical Significance is used to evaluate the trend<br>over 4 to 10 periods of measure, subject to data availability and comparability.
People 25+ with a Bachelor's Degree or Higher Census Tract: 06045011800
People 25+ with a Bachelor's Degree or Higher Census Tract: 06045011800
20.7%
(2018-2022)
Compared to:
CA Census Tracts
The distribution is based on data from 9,076 California census tracts.
U.S. Census Tracts
The distribution is based on data from 82,720 U.S. census tracts.
Mendocino, CA County Value
(24.0%)
The regional value is compared to the Mendocino County value.
Trend
This comparison measures the indicator’s values over multiple time periods.<br>The Mann-Kendall Test for Statistical Significance is used to evaluate the trend<br>over 4 to 10 periods of measure, subject to data availability and comparability.
Education / Educational Attainment
People 25+ with a High School Diploma or Higher
Value
Compared to:
People 25+ with a High School Diploma or Higher County: Mendocino
People 25+ with a High School Diploma or Higher County: Mendocino
86.8%
(2018-2022)
Compared to:
CA Counties
The distribution is based on data from 58 California counties.
U.S. Counties
The distribution is based on data from 3,133 U.S. counties and county equivalents.
CA Value
(84.4%)
The regional value is compared to the California state value.
US Value
(89.1%)
The regional value is compared to the national value.
Trend
This comparison measures the indicator’s values over multiple time periods.<br>The Mann-Kendall Test for Statistical Significance is used to evaluate the trend<br>over 4 to 10 periods of measure, subject to data availability and comparability.
People 25+ with a High School Diploma or Higher Census Place: Albion
People 25+ with a High School Diploma or Higher Census Place: Albion
100.0%
(2018-2022)
Compared to:
CA Census Places
The distribution is based on data from 1,482 locales.
U.S. Census Places
The distribution is based on data from 28,880 U.S. Census Places.
Mendocino, CA County Value
(86.8%)
The regional value is compared to the Mendocino County value.
CA Value
(84.4%)
The regional value is compared to the California state value.
US Value
(89.1%)
The regional value is compared to the national value.
Trend
This comparison measures the indicator’s values over multiple time periods.<br>The Mann-Kendall Test for Statistical Significance is used to evaluate the trend<br>over 4 to 10 periods of measure, subject to data availability and comparability.
People 25+ with a High School Diploma or Higher Census Place: Anchor Bay
People 25+ with a High School Diploma or Higher Census Place: Anchor Bay
100.0%
(2018-2022)
Compared to:
CA Census Places
The distribution is based on data from 1,482 locales.
U.S. Census Places
The distribution is based on data from 28,880 U.S. Census Places.
Mendocino, CA County Value
(86.8%)
The regional value is compared to the Mendocino County value.
CA Value
(84.4%)
The regional value is compared to the California state value.
US Value
(89.1%)
The regional value is compared to the national value.
Trend
This comparison measures the indicator’s values over multiple time periods.<br>The Mann-Kendall Test for Statistical Significance is used to evaluate the trend<br>over 4 to 10 periods of measure, subject to data availability and comparability.
People 25+ with a High School Diploma or Higher Census Place: Boonville
People 25+ with a High School Diploma or Higher Census Place: Boonville
86.3%
(2018-2022)
Compared to:
CA Census Places
The distribution is based on data from 1,482 locales.
U.S. Census Places
The distribution is based on data from 28,880 U.S. Census Places.
Mendocino, CA County Value
(86.8%)
The regional value is compared to the Mendocino County value.
CA Value
(84.4%)
The regional value is compared to the California state value.
US Value
(89.1%)
The regional value is compared to the national value.
Trend
This comparison measures the indicator’s values over multiple time periods.<br>The Mann-Kendall Test for Statistical Significance is used to evaluate the trend<br>over 4 to 10 periods of measure, subject to data availability and comparability.
People 25+ with a High School Diploma or Higher Census Place: Brooktrails
People 25+ with a High School Diploma or Higher Census Place: Brooktrails
86.6%
(2018-2022)
Compared to:

CA Census Places
The distribution is based on data from 1,482 locales.
U.S. Census Places
The distribution is based on data from 28,880 U.S. Census Places.
Mendocino, CA County Value
(86.8%)
The regional value is compared to the Mendocino County value.
CA Value
(84.4%)
The regional value is compared to the California state value.
US Value
(89.1%)
The regional value is compared to the national value.
Trend
This comparison measures the indicator’s values over multiple time periods.<br>The Mann-Kendall Test for Statistical Significance is used to evaluate the trend<br>over 4 to 10 periods of measure, subject to data availability and comparability.
People 25+ with a High School Diploma or Higher Census Place: Calpella
People 25+ with a High School Diploma or Higher Census Place: Calpella
78.0%
(2018-2022)
Compared to:

CA Census Places
The distribution is based on data from 1,482 locales.
U.S. Census Places
The distribution is based on data from 28,880 U.S. Census Places.
Mendocino, CA County Value
(86.8%)
The regional value is compared to the Mendocino County value.
CA Value
(84.4%)
The regional value is compared to the California state value.
US Value
(89.1%)
The regional value is compared to the national value.
Trend
This comparison measures the indicator’s values over multiple time periods.<br>The Mann-Kendall Test for Statistical Significance is used to evaluate the trend<br>over 4 to 10 periods of measure, subject to data availability and comparability.
People 25+ with a High School Diploma or Higher Census Place: Caspar
People 25+ with a High School Diploma or Higher Census Place: Caspar
99.6%
(2018-2022)
Compared to:
CA Census Places
The distribution is based on data from 1,482 locales.
U.S. Census Places
The distribution is based on data from 28,880 U.S. Census Places.
Mendocino, CA County Value
(86.8%)
The regional value is compared to the Mendocino County value.
CA Value
(84.4%)
The regional value is compared to the California state value.
US Value
(89.1%)
The regional value is compared to the national value.
Trend
This comparison measures the indicator’s values over multiple time periods.<br>The Mann-Kendall Test for Statistical Significance is used to evaluate the trend<br>over 4 to 10 periods of measure, subject to data availability and comparability.
People 25+ with a High School Diploma or Higher Census Place: Cleone
People 25+ with a High School Diploma or Higher Census Place: Cleone
64.4%
(2018-2022)
Compared to:
CA Census Places
The distribution is based on data from 1,482 locales.
U.S. Census Places
The distribution is based on data from 28,880 U.S. Census Places.
Mendocino, CA County Value
(86.8%)
The regional value is compared to the Mendocino County value.
CA Value
(84.4%)
The regional value is compared to the California state value.
US Value
(89.1%)
The regional value is compared to the national value.
Trend
This comparison measures the indicator’s values over multiple time periods.<br>The Mann-Kendall Test for Statistical Significance is used to evaluate the trend<br>over 4 to 10 periods of measure, subject to data availability and comparability.
People 25+ with a High School Diploma or Higher Census Place: Comptche
People 25+ with a High School Diploma or Higher Census Place: Comptche
100.0%
(2018-2022)
Compared to:
CA Census Places
The distribution is based on data from 1,482 locales.
U.S. Census Places
The distribution is based on data from 28,880 U.S. Census Places.
Mendocino, CA County Value
(86.8%)
The regional value is compared to the Mendocino County value.
CA Value
(84.4%)
The regional value is compared to the California state value.
US Value
(89.1%)
The regional value is compared to the national value.
Trend
This comparison measures the indicator’s values over multiple time periods.<br>The Mann-Kendall Test for Statistical Significance is used to evaluate the trend<br>over 4 to 10 periods of measure, subject to data availability and comparability.
People 25+ with a High School Diploma or Higher Census Place: Covelo
People 25+ with a High School Diploma or Higher Census Place: Covelo
73.5%
(2018-2022)
Compared to:
CA Census Places
The distribution is based on data from 1,482 locales.
U.S. Census Places
The distribution is based on data from 28,880 U.S. Census Places.
Mendocino, CA County Value
(86.8%)
The regional value is compared to the Mendocino County value.
CA Value
(84.4%)
The regional value is compared to the California state value.
US Value
(89.1%)
The regional value is compared to the national value.
Trend
This comparison measures the indicator’s values over multiple time periods.<br>The Mann-Kendall Test for Statistical Significance is used to evaluate the trend<br>over 4 to 10 periods of measure, subject to data availability and comparability.
People 25+ with a High School Diploma or Higher Census Place: Fort Bragg
People 25+ with a High School Diploma or Higher Census Place: Fort Bragg
84.7%
(2018-2022)
Compared to:
CA Census Places
The distribution is based on data from 1,482 locales.
U.S. Census Places
The distribution is based on data from 28,880 U.S. Census Places.
Mendocino, CA County Value
(86.8%)
The regional value is compared to the Mendocino County value.
CA Value
(84.4%)
The regional value is compared to the California state value.
US Value
(89.1%)
The regional value is compared to the national value.
Trend
This comparison measures the indicator’s values over multiple time periods.<br>The Mann-Kendall Test for Statistical Significance is used to evaluate the trend<br>over 4 to 10 periods of measure, subject to data availability and comparability.
People 25+ with a High School Diploma or Higher Census Place: Hopland
People 25+ with a High School Diploma or Higher Census Place: Hopland
70.4%
(2018-2022)
Compared to:
CA Census Places
The distribution is based on data from 1,482 locales.
U.S. Census Places
The distribution is based on data from 28,880 U.S. Census Places.
Mendocino, CA County Value
(86.8%)
The regional value is compared to the Mendocino County value.
CA Value
(84.4%)
The regional value is compared to the California state value.
US Value
(89.1%)
The regional value is compared to the national value.
Trend
This comparison measures the indicator’s values over multiple time periods.<br>The Mann-Kendall Test for Statistical Significance is used to evaluate the trend<br>over 4 to 10 periods of measure, subject to data availability and comparability.
People 25+ with a High School Diploma or Higher Census Place: Laytonville
People 25+ with a High School Diploma or Higher Census Place: Laytonville
92.0%
(2018-2022)
Compared to:
CA Census Places
The distribution is based on data from 1,482 locales.
U.S. Census Places
The distribution is based on data from 28,880 U.S. Census Places.
Mendocino, CA County Value
(86.8%)
The regional value is compared to the Mendocino County value.
CA Value
(84.4%)
The regional value is compared to the California state value.
US Value
(89.1%)
The regional value is compared to the national value.
Trend
This comparison measures the indicator’s values over multiple time periods.<br>The Mann-Kendall Test for Statistical Significance is used to evaluate the trend<br>over 4 to 10 periods of measure, subject to data availability and comparability.
People 25+ with a High School Diploma or Higher Census Place: Leggett
People 25+ with a High School Diploma or Higher Census Place: Leggett
65.8%
(2018-2022)
Compared to:
CA Census Places
The distribution is based on data from 1,482 locales.
U.S. Census Places
The distribution is based on data from 28,880 U.S. Census Places.
Mendocino, CA County Value
(86.8%)
The regional value is compared to the Mendocino County value.
CA Value
(84.4%)
The regional value is compared to the California state value.
US Value
(89.1%)
The regional value is compared to the national value.
Trend
This comparison measures the indicator’s values over multiple time periods.<br>The Mann-Kendall Test for Statistical Significance is used to evaluate the trend<br>over 4 to 10 periods of measure, subject to data availability and comparability.
People 25+ with a High School Diploma or Higher Census Place: Little River
People 25+ with a High School Diploma or Higher Census Place: Little River
94.3%
(2018-2022)
Compared to:
CA Census Places
The distribution is based on data from 1,482 locales.
U.S. Census Places
The distribution is based on data from 28,880 U.S. Census Places.
Mendocino, CA County Value
(86.8%)
The regional value is compared to the Mendocino County value.
CA Value
(84.4%)
The regional value is compared to the California state value.
US Value
(89.1%)
The regional value is compared to the national value.
Trend
This comparison measures the indicator’s values over multiple time periods.<br>The Mann-Kendall Test for Statistical Significance is used to evaluate the trend<br>over 4 to 10 periods of measure, subject to data availability and comparability.
People 25+ with a High School Diploma or Higher Census Place: Manchester
People 25+ with a High School Diploma or Higher Census Place: Manchester
62.4%
(2018-2022)
Compared to:
CA Census Places
The distribution is based on data from 1,482 locales.
U.S. Census Places
The distribution is based on data from 28,880 U.S. Census Places.
Mendocino, CA County Value
(86.8%)
The regional value is compared to the Mendocino County value.
CA Value
(84.4%)
The regional value is compared to the California state value.
US Value
(89.1%)
The regional value is compared to the national value.
Trend
This comparison measures the indicator’s values over multiple time periods.<br>The Mann-Kendall Test for Statistical Significance is used to evaluate the trend<br>over 4 to 10 periods of measure, subject to data availability and comparability.
People 25+ with a High School Diploma or Higher Census Place: Mendocino
People 25+ with a High School Diploma or Higher Census Place: Mendocino
97.1%
(2018-2022)
Compared to:
CA Census Places
The distribution is based on data from 1,482 locales.
U.S. Census Places
The distribution is based on data from 28,880 U.S. Census Places.
Mendocino, CA County Value
(86.8%)
The regional value is compared to the Mendocino County value.
CA Value
(84.4%)
The regional value is compared to the California state value.
US Value
(89.1%)
The regional value is compared to the national value.
Trend
This comparison measures the indicator’s values over multiple time periods.<br>The Mann-Kendall Test for Statistical Significance is used to evaluate the trend<br>over 4 to 10 periods of measure, subject to data availability and comparability.
People 25+ with a High School Diploma or Higher Census Place: Philo
People 25+ with a High School Diploma or Higher Census Place: Philo
100.0%
(2018-2022)
Compared to:
CA Census Places
The distribution is based on data from 1,482 locales.
U.S. Census Places
The distribution is based on data from 28,880 U.S. Census Places.
Mendocino, CA County Value
(86.8%)
The regional value is compared to the Mendocino County value.
CA Value
(84.4%)
The regional value is compared to the California state value.
US Value
(89.1%)
The regional value is compared to the national value.
Trend
This comparison measures the indicator’s values over multiple time periods.<br>The Mann-Kendall Test for Statistical Significance is used to evaluate the trend<br>over 4 to 10 periods of measure, subject to data availability and comparability.
People 25+ with a High School Diploma or Higher Census Place: Point Arena
People 25+ with a High School Diploma or Higher Census Place: Point Arena
79.5%
(2018-2022)
Compared to:
CA Census Places
The distribution is based on data from 1,482 locales.
U.S. Census Places
The distribution is based on data from 28,880 U.S. Census Places.
Mendocino, CA County Value
(86.8%)
The regional value is compared to the Mendocino County value.
CA Value
(84.4%)
The regional value is compared to the California state value.
US Value
(89.1%)
The regional value is compared to the national value.
Trend
This comparison measures the indicator’s values over multiple time periods.<br>The Mann-Kendall Test for Statistical Significance is used to evaluate the trend<br>over 4 to 10 periods of measure, subject to data availability and comparability.
People 25+ with a High School Diploma or Higher Census Place: Potter Valley
People 25+ with a High School Diploma or Higher Census Place: Potter Valley
98.4%
(2018-2022)
Compared to:
CA Census Places
The distribution is based on data from 1,482 locales.
U.S. Census Places
The distribution is based on data from 28,880 U.S. Census Places.
Mendocino, CA County Value
(86.8%)
The regional value is compared to the Mendocino County value.
CA Value
(84.4%)
The regional value is compared to the California state value.
US Value
(89.1%)
The regional value is compared to the national value.
Trend
This comparison measures the indicator’s values over multiple time periods.<br>The Mann-Kendall Test for Statistical Significance is used to evaluate the trend<br>over 4 to 10 periods of measure, subject to data availability and comparability.
People 25+ with a High School Diploma or Higher Census Place: Redwood Valley
People 25+ with a High School Diploma or Higher Census Place: Redwood Valley
82.6%
(2018-2022)
Compared to:
CA Census Places
The distribution is based on data from 1,482 locales.
U.S. Census Places
The distribution is based on data from 28,880 U.S. Census Places.
Mendocino, CA County Value
(86.8%)
The regional value is compared to the Mendocino County value.
CA Value
(84.4%)
The regional value is compared to the California state value.
US Value
(89.1%)
The regional value is compared to the national value.
Trend
This comparison measures the indicator’s values over multiple time periods.<br>The Mann-Kendall Test for Statistical Significance is used to evaluate the trend<br>over 4 to 10 periods of measure, subject to data availability and comparability.
People 25+ with a High School Diploma or Higher Census Place: Talmage
People 25+ with a High School Diploma or Higher Census Place: Talmage
90.0%
(2018-2022)
Compared to:
CA Census Places
The distribution is based on data from 1,482 locales.
U.S. Census Places
The distribution is based on data from 28,880 U.S. Census Places.
Mendocino, CA County Value
(86.8%)
The regional value is compared to the Mendocino County value.
CA Value
(84.4%)
The regional value is compared to the California state value.
US Value
(89.1%)
The regional value is compared to the national value.
Trend
This comparison measures the indicator’s values over multiple time periods.<br>The Mann-Kendall Test for Statistical Significance is used to evaluate the trend<br>over 4 to 10 periods of measure, subject to data availability and comparability.
People 25+ with a High School Diploma or Higher Census Place: Ukiah
People 25+ with a High School Diploma or Higher Census Place: Ukiah
83.7%
(2018-2022)
Compared to:
CA Census Places
The distribution is based on data from 1,482 locales.
U.S. Census Places
The distribution is based on data from 28,880 U.S. Census Places.
Mendocino, CA County Value
(86.8%)
The regional value is compared to the Mendocino County value.
CA Value
(84.4%)
The regional value is compared to the California state value.
US Value
(89.1%)
The regional value is compared to the national value.
Trend
This comparison measures the indicator’s values over multiple time periods.<br>The Mann-Kendall Test for Statistical Significance is used to evaluate the trend<br>over 4 to 10 periods of measure, subject to data availability and comparability.
People 25+ with a High School Diploma or Higher Census Place: Willits
People 25+ with a High School Diploma or Higher Census Place: Willits
84.1%
(2018-2022)
Compared to:
CA Census Places
The distribution is based on data from 1,482 locales.
U.S. Census Places
The distribution is based on data from 28,880 U.S. Census Places.
Mendocino, CA County Value
(86.8%)
The regional value is compared to the Mendocino County value.
CA Value
(84.4%)
The regional value is compared to the California state value.
US Value
(89.1%)
The regional value is compared to the national value.
Trend
This comparison measures the indicator’s values over multiple time periods.<br>The Mann-Kendall Test for Statistical Significance is used to evaluate the trend<br>over 4 to 10 periods of measure, subject to data availability and comparability.
People 25+ with a High School Diploma or Higher Zip Code: 95410
People 25+ with a High School Diploma or Higher Zip Code: 95410
96.6%
(2018-2022)
Compared to:
CA Zip Codes
The distribution is based on data from 1,761 California zip codes.
U.S. Zip Codes
The distribution is based on data from 32,998 U.S. zip codes.
Mendocino, CA County Value
(86.8%)
The regional value is compared to the Mendocino County value.
Trend
This comparison measures the indicator’s values over multiple time periods.<br>The Mann-Kendall Test for Statistical Significance is used to evaluate the trend<br>over 4 to 10 periods of measure, subject to data availability and comparability.
People 25+ with a High School Diploma or Higher Zip Code: 95415
People 25+ with a High School Diploma or Higher Zip Code: 95415
85.3%
(2018-2022)
Compared to:
CA Zip Codes
The distribution is based on data from 1,761 California zip codes.
U.S. Zip Codes
The distribution is based on data from 32,998 U.S. zip codes.
Mendocino, CA County Value
(86.8%)
The regional value is compared to the Mendocino County value.
Trend
This comparison measures the indicator’s values over multiple time periods.<br>The Mann-Kendall Test for Statistical Significance is used to evaluate the trend<br>over 4 to 10 periods of measure, subject to data availability and comparability.
People 25+ with a High School Diploma or Higher Zip Code: 95417
People 25+ with a High School Diploma or Higher Zip Code: 95417
88.0%
(2018-2022)
Compared to:
CA Zip Codes
The distribution is based on data from 1,761 California zip codes.
U.S. Zip Codes
The distribution is based on data from 32,998 U.S. zip codes.
Mendocino, CA County Value
(86.8%)
The regional value is compared to the Mendocino County value.
Trend
This comparison measures the indicator’s values over multiple time periods.<br>The Mann-Kendall Test for Statistical Significance is used to evaluate the trend<br>over 4 to 10 periods of measure, subject to data availability and comparability.
People 25+ with a High School Diploma or Higher Zip Code: 95420
People 25+ with a High School Diploma or Higher Zip Code: 95420
99.6%
(2018-2022)
Compared to:
CA Zip Codes
The distribution is based on data from 1,761 California zip codes.
U.S. Zip Codes
The distribution is based on data from 32,998 U.S. zip codes.
Mendocino, CA County Value
(86.8%)
The regional value is compared to the Mendocino County value.
Trend
This comparison measures the indicator’s values over multiple time periods.<br>The Mann-Kendall Test for Statistical Significance is used to evaluate the trend<br>over 4 to 10 periods of measure, subject to data availability and comparability.
People 25+ with a High School Diploma or Higher Zip Code: 95427
People 25+ with a High School Diploma or Higher Zip Code: 95427
91.8%
(2018-2022)
Compared to:
CA Zip Codes
The distribution is based on data from 1,761 California zip codes.
U.S. Zip Codes
The distribution is based on data from 32,998 U.S. zip codes.
Mendocino, CA County Value
(86.8%)
The regional value is compared to the Mendocino County value.
Trend
This comparison measures the indicator’s values over multiple time periods.<br>The Mann-Kendall Test for Statistical Significance is used to evaluate the trend<br>over 4 to 10 periods of measure, subject to data availability and comparability.
People 25+ with a High School Diploma or Higher Zip Code: 95428
People 25+ with a High School Diploma or Higher Zip Code: 95428
79.7%
(2018-2022)
Compared to:
CA Zip Codes
The distribution is based on data from 1,761 California zip codes.
U.S. Zip Codes
The distribution is based on data from 32,998 U.S. zip codes.
Mendocino, CA County Value
(86.8%)
The regional value is compared to the Mendocino County value.
Trend
This comparison measures the indicator’s values over multiple time periods.<br>The Mann-Kendall Test for Statistical Significance is used to evaluate the trend<br>over 4 to 10 periods of measure, subject to data availability and comparability.
People 25+ with a High School Diploma or Higher Zip Code: 95429
People 25+ with a High School Diploma or Higher Zip Code: 95429
100.0%
(2018-2022)
Compared to:
CA Zip Codes
The distribution is based on data from 1,761 California zip codes.
U.S. Zip Codes
The distribution is based on data from 32,998 U.S. zip codes.
Mendocino, CA County Value
(86.8%)
The regional value is compared to the Mendocino County value.
Trend
This comparison measures the indicator’s values over multiple time periods.<br>The Mann-Kendall Test for Statistical Significance is used to evaluate the trend<br>over 4 to 10 periods of measure, subject to data availability and comparability.
People 25+ with a High School Diploma or Higher Zip Code: 95432
People 25+ with a High School Diploma or Higher Zip Code: 95432
98.2%
(2018-2022)
Compared to:
CA Zip Codes
The distribution is based on data from 1,761 California zip codes.
U.S. Zip Codes
The distribution is based on data from 32,998 U.S. zip codes.
Mendocino, CA County Value
(86.8%)
The regional value is compared to the Mendocino County value.
Trend
This comparison measures the indicator’s values over multiple time periods.<br>The Mann-Kendall Test for Statistical Significance is used to evaluate the trend<br>over 4 to 10 periods of measure, subject to data availability and comparability.
People 25+ with a High School Diploma or Higher Zip Code: 95437
People 25+ with a High School Diploma or Higher Zip Code: 95437
88.7%
(2018-2022)
Compared to:
CA Zip Codes
The distribution is based on data from 1,761 California zip codes.
U.S. Zip Codes
The distribution is based on data from 32,998 U.S. zip codes.
Mendocino, CA County Value
(86.8%)
The regional value is compared to the Mendocino County value.
Trend
This comparison measures the indicator’s values over multiple time periods.<br>The Mann-Kendall Test for Statistical Significance is used to evaluate the trend<br>over 4 to 10 periods of measure, subject to data availability and comparability.
People 25+ with a High School Diploma or Higher Zip Code: 95445
People 25+ with a High School Diploma or Higher Zip Code: 95445
92.3%
(2018-2022)
Compared to:
CA Zip Codes
The distribution is based on data from 1,761 California zip codes.
U.S. Zip Codes
The distribution is based on data from 32,998 U.S. zip codes.
Mendocino, CA County Value
(86.8%)
The regional value is compared to the Mendocino County value.
Trend
This comparison measures the indicator’s values over multiple time periods.<br>The Mann-Kendall Test for Statistical Significance is used to evaluate the trend<br>over 4 to 10 periods of measure, subject to data availability and comparability.
People 25+ with a High School Diploma or Higher Zip Code: 95449
People 25+ with a High School Diploma or Higher Zip Code: 95449
69.7%
(2018-2022)
Compared to:
CA Zip Codes
The distribution is based on data from 1,761 California zip codes.
U.S. Zip Codes
The distribution is based on data from 32,998 U.S. zip codes.
Mendocino, CA County Value
(86.8%)
The regional value is compared to the Mendocino County value.
Trend
This comparison measures the indicator’s values over multiple time periods.<br>The Mann-Kendall Test for Statistical Significance is used to evaluate the trend<br>over 4 to 10 periods of measure, subject to data availability and comparability.
People 25+ with a High School Diploma or Higher Zip Code: 95454
People 25+ with a High School Diploma or Higher Zip Code: 95454
80.2%
(2018-2022)
Compared to:
CA Zip Codes
The distribution is based on data from 1,761 California zip codes.
U.S. Zip Codes
The distribution is based on data from 32,998 U.S. zip codes.
Mendocino, CA County Value
(86.8%)
The regional value is compared to the Mendocino County value.
Trend
This comparison measures the indicator’s values over multiple time periods.<br>The Mann-Kendall Test for Statistical Significance is used to evaluate the trend<br>over 4 to 10 periods of measure, subject to data availability and comparability.
People 25+ with a High School Diploma or Higher Zip Code: 95456
People 25+ with a High School Diploma or Higher Zip Code: 95456
94.9%
(2018-2022)
Compared to:
CA Zip Codes
The distribution is based on data from 1,761 California zip codes.
U.S. Zip Codes
The distribution is based on data from 32,998 U.S. zip codes.
Mendocino, CA County Value
(86.8%)
The regional value is compared to the Mendocino County value.
Trend
This comparison measures the indicator’s values over multiple time periods.<br>The Mann-Kendall Test for Statistical Significance is used to evaluate the trend<br>over 4 to 10 periods of measure, subject to data availability and comparability.
People 25+ with a High School Diploma or Higher Zip Code: 95459
People 25+ with a High School Diploma or Higher Zip Code: 95459
75.8%
(2018-2022)
Compared to:
CA Zip Codes
The distribution is based on data from 1,761 California zip codes.
U.S. Zip Codes
The distribution is based on data from 32,998 U.S. zip codes.
Mendocino, CA County Value
(86.8%)
The regional value is compared to the Mendocino County value.
Trend
This comparison measures the indicator’s values over multiple time periods.<br>The Mann-Kendall Test for Statistical Significance is used to evaluate the trend<br>over 4 to 10 periods of measure, subject to data availability and comparability.
People 25+ with a High School Diploma or Higher Zip Code: 95460
People 25+ with a High School Diploma or Higher Zip Code: 95460
94.3%
(2018-2022)
Compared to:
CA Zip Codes
The distribution is based on data from 1,761 California zip codes.
U.S. Zip Codes
The distribution is based on data from 32,998 U.S. zip codes.
Mendocino, CA County Value
(86.8%)
The regional value is compared to the Mendocino County value.
Trend
This comparison measures the indicator’s values over multiple time periods.<br>The Mann-Kendall Test for Statistical Significance is used to evaluate the trend<br>over 4 to 10 periods of measure, subject to data availability and comparability.
People 25+ with a High School Diploma or Higher Zip Code: 95463
People 25+ with a High School Diploma or Higher Zip Code: 95463
100.0%
(2018-2022)
Compared to:
CA Zip Codes
The distribution is based on data from 1,761 California zip codes.
U.S. Zip Codes
The distribution is based on data from 32,998 U.S. zip codes.
Mendocino, CA County Value
(86.8%)
The regional value is compared to the Mendocino County value.
Trend
This comparison measures the indicator’s values over multiple time periods.<br>The Mann-Kendall Test for Statistical Significance is used to evaluate the trend<br>over 4 to 10 periods of measure, subject to data availability and comparability.
People 25+ with a High School Diploma or Higher Zip Code: 95466
People 25+ with a High School Diploma or Higher Zip Code: 95466
84.0%
(2018-2022)
Compared to:
CA Zip Codes
The distribution is based on data from 1,761 California zip codes.
U.S. Zip Codes
The distribution is based on data from 32,998 U.S. zip codes.
Mendocino, CA County Value
(86.8%)
The regional value is compared to the Mendocino County value.
Trend
This comparison measures the indicator’s values over multiple time periods.<br>The Mann-Kendall Test for Statistical Significance is used to evaluate the trend<br>over 4 to 10 periods of measure, subject to data availability and comparability.
People 25+ with a High School Diploma or Higher Zip Code: 95468
People 25+ with a High School Diploma or Higher Zip Code: 95468
91.1%
(2018-2022)
Compared to:
CA Zip Codes
The distribution is based on data from 1,761 California zip codes.
U.S. Zip Codes
The distribution is based on data from 32,998 U.S. zip codes.
Mendocino, CA County Value
(86.8%)
The regional value is compared to the Mendocino County value.
Trend
This comparison measures the indicator’s values over multiple time periods.<br>The Mann-Kendall Test for Statistical Significance is used to evaluate the trend<br>over 4 to 10 periods of measure, subject to data availability and comparability.
People 25+ with a High School Diploma or Higher Zip Code: 95469
People 25+ with a High School Diploma or Higher Zip Code: 95469
96.4%
(2018-2022)
Compared to:
CA Zip Codes
The distribution is based on data from 1,761 California zip codes.
U.S. Zip Codes
The distribution is based on data from 32,998 U.S. zip codes.
Mendocino, CA County Value
(86.8%)
The regional value is compared to the Mendocino County value.
Trend
This comparison measures the indicator’s values over multiple time periods.<br>The Mann-Kendall Test for Statistical Significance is used to evaluate the trend<br>over 4 to 10 periods of measure, subject to data availability and comparability.
People 25+ with a High School Diploma or Higher Zip Code: 95470
People 25+ with a High School Diploma or Higher Zip Code: 95470
89.7%
(2018-2022)
Compared to:
CA Zip Codes
The distribution is based on data from 1,761 California zip codes.
U.S. Zip Codes
The distribution is based on data from 32,998 U.S. zip codes.
Mendocino, CA County Value
(86.8%)
The regional value is compared to the Mendocino County value.
Trend
This comparison measures the indicator’s values over multiple time periods.<br>The Mann-Kendall Test for Statistical Significance is used to evaluate the trend<br>over 4 to 10 periods of measure, subject to data availability and comparability.
People 25+ with a High School Diploma or Higher Zip Code: 95482
People 25+ with a High School Diploma or Higher Zip Code: 95482
84.0%
(2018-2022)
Compared to:
CA Zip Codes
The distribution is based on data from 1,761 California zip codes.
U.S. Zip Codes
The distribution is based on data from 32,998 U.S. zip codes.
Mendocino, CA County Value
(86.8%)
The regional value is compared to the Mendocino County value.
Trend
This comparison measures the indicator’s values over multiple time periods.<br>The Mann-Kendall Test for Statistical Significance is used to evaluate the trend<br>over 4 to 10 periods of measure, subject to data availability and comparability.
People 25+ with a High School Diploma or Higher Zip Code: 95488
People 25+ with a High School Diploma or Higher Zip Code: 95488
100.0%
(2018-2022)
Compared to:
CA Zip Codes
The distribution is based on data from 1,761 California zip codes.
U.S. Zip Codes
The distribution is based on data from 32,998 U.S. zip codes.
Mendocino, CA County Value
(86.8%)
The regional value is compared to the Mendocino County value.
Trend
This comparison measures the indicator’s values over multiple time periods.<br>The Mann-Kendall Test for Statistical Significance is used to evaluate the trend<br>over 4 to 10 periods of measure, subject to data availability and comparability.
People 25+ with a High School Diploma or Higher Zip Code: 95490
People 25+ with a High School Diploma or Higher Zip Code: 95490
88.2%
(2018-2022)
Compared to:
CA Zip Codes
The distribution is based on data from 1,761 California zip codes.
U.S. Zip Codes
The distribution is based on data from 32,998 U.S. zip codes.
Mendocino, CA County Value
(86.8%)
The regional value is compared to the Mendocino County value.
Trend
This comparison measures the indicator’s values over multiple time periods.<br>The Mann-Kendall Test for Statistical Significance is used to evaluate the trend<br>over 4 to 10 periods of measure, subject to data availability and comparability.
People 25+ with a High School Diploma or Higher Zip Code: 95494
People 25+ with a High School Diploma or Higher Zip Code: 95494
100.0%
(2018-2022)
Compared to:
CA Zip Codes
The distribution is based on data from 1,761 California zip codes.
U.S. Zip Codes
The distribution is based on data from 32,998 U.S. zip codes.
Mendocino, CA County Value
(86.8%)
The regional value is compared to the Mendocino County value.
Trend
This comparison measures the indicator’s values over multiple time periods.<br>The Mann-Kendall Test for Statistical Significance is used to evaluate the trend<br>over 4 to 10 periods of measure, subject to data availability and comparability.
People 25+ with a High School Diploma or Higher Zip Code: 95585
People 25+ with a High School Diploma or Higher Zip Code: 95585
84.3%
(2018-2022)
Compared to:
CA Zip Codes
The distribution is based on data from 1,761 California zip codes.
U.S. Zip Codes
The distribution is based on data from 32,998 U.S. zip codes.
Mendocino, CA County Value
(86.8%)
The regional value is compared to the Mendocino County value.
Trend
This comparison measures the indicator’s values over multiple time periods.<br>The Mann-Kendall Test for Statistical Significance is used to evaluate the trend<br>over 4 to 10 periods of measure, subject to data availability and comparability.
People 25+ with a High School Diploma or Higher Zip Code: 95587
People 25+ with a High School Diploma or Higher Zip Code: 95587
100.0%
(2017-2021)
Compared to:
CA Zip Codes
The distribution is based on data from 1,759 California zip codes.
U.S. Zip Codes
The distribution is based on data from 33,000 U.S. zip codes.
Mendocino, CA County Value
(86.6%)
The regional value is compared to the Mendocino County value.
Trend
This comparison measures the indicator’s values over multiple time periods.<br>The Mann-Kendall Test for Statistical Significance is used to evaluate the trend<br>over 4 to 10 periods of measure, subject to data availability and comparability.
People 25+ with a High School Diploma or Higher Census Tract: 06045010100
People 25+ with a High School Diploma or Higher Census Tract: 06045010100
80.4%
(2018-2022)
Compared to:
CA Census Tracts
The distribution is based on data from 9,076 California census tracts.
U.S. Census Tracts
The distribution is based on data from 82,720 U.S. census tracts.
Mendocino, CA County Value
(86.8%)
The regional value is compared to the Mendocino County value.
Trend
This comparison measures the indicator’s values over multiple time periods.<br>The Mann-Kendall Test for Statistical Significance is used to evaluate the trend<br>over 4 to 10 periods of measure, subject to data availability and comparability.
People 25+ with a High School Diploma or Higher Census Tract: 06045010200
People 25+ with a High School Diploma or Higher Census Tract: 06045010200
85.6%
(2018-2022)
Compared to:
CA Census Tracts
The distribution is based on data from 9,076 California census tracts.
U.S. Census Tracts
The distribution is based on data from 82,720 U.S. census tracts.
Mendocino, CA County Value
(86.8%)
The regional value is compared to the Mendocino County value.
Trend
This comparison measures the indicator’s values over multiple time periods.<br>The Mann-Kendall Test for Statistical Significance is used to evaluate the trend<br>over 4 to 10 periods of measure, subject to data availability and comparability.
People 25+ with a High School Diploma or Higher Census Tract: 06045010300
People 25+ with a High School Diploma or Higher Census Tract: 06045010300
90.0%
(2018-2022)
Compared to:
CA Census Tracts
The distribution is based on data from 9,076 California census tracts.
U.S. Census Tracts
The distribution is based on data from 82,720 U.S. census tracts.
Mendocino, CA County Value
(86.8%)
The regional value is compared to the Mendocino County value.
Trend
This comparison measures the indicator’s values over multiple time periods.<br>The Mann-Kendall Test for Statistical Significance is used to evaluate the trend<br>over 4 to 10 periods of measure, subject to data availability and comparability.
People 25+ with a High School Diploma or Higher Census Tract: 06045010400
People 25+ with a High School Diploma or Higher Census Tract: 06045010400
90.3%
(2018-2022)
Compared to:
CA Census Tracts
The distribution is based on data from 9,076 California census tracts.
U.S. Census Tracts
The distribution is based on data from 82,720 U.S. census tracts.
Mendocino, CA County Value
(86.8%)
The regional value is compared to the Mendocino County value.
Trend
This comparison measures the indicator’s values over multiple time periods.<br>The Mann-Kendall Test for Statistical Significance is used to evaluate the trend<br>over 4 to 10 periods of measure, subject to data availability and comparability.
People 25+ with a High School Diploma or Higher Census Tract: 06045010500
People 25+ with a High School Diploma or Higher Census Tract: 06045010500
82.3%
(2018-2022)
Compared to:
CA Census Tracts
The distribution is based on data from 9,076 California census tracts.
U.S. Census Tracts
The distribution is based on data from 82,720 U.S. census tracts.
Mendocino, CA County Value
(86.8%)
The regional value is compared to the Mendocino County value.
Trend
This comparison measures the indicator’s values over multiple time periods.<br>The Mann-Kendall Test for Statistical Significance is used to evaluate the trend<br>over 4 to 10 periods of measure, subject to data availability and comparability.
People 25+ with a High School Diploma or Higher Census Tract: 06045010600
People 25+ with a High School Diploma or Higher Census Tract: 06045010600
89.4%
(2015-2019)
Compared to:
CA Census Tracts
The distribution is based on data from 8,009 California census tracts.
U.S. Census Tracts
The distribution is based on data from 72,386 U.S. census tracts.
Mendocino, CA County Value
(86.5%)
The regional value is compared to the Mendocino County value.
People 25+ with a High School Diploma or Higher Census Tract: 06045010601
People 25+ with a High School Diploma or Higher Census Tract: 06045010601
88.8%
(2018-2022)
Compared to:
CA Census Tracts
The distribution is based on data from 9,076 California census tracts.
U.S. Census Tracts
The distribution is based on data from 82,720 U.S. census tracts.
Mendocino, CA County Value
(86.8%)
The regional value is compared to the Mendocino County value.
People 25+ with a High School Diploma or Higher Census Tract: 06045010602
People 25+ with a High School Diploma or Higher Census Tract: 06045010602
89.3%
(2018-2022)
Compared to:
CA Census Tracts
The distribution is based on data from 9,076 California census tracts.
U.S. Census Tracts
The distribution is based on data from 82,720 U.S. census tracts.
Mendocino, CA County Value
(86.8%)
The regional value is compared to the Mendocino County value.
People 25+ with a High School Diploma or Higher Census Tract: 06045010700
People 25+ with a High School Diploma or Higher Census Tract: 06045010700
86.9%
(2018-2022)
Compared to:
CA Census Tracts
The distribution is based on data from 9,076 California census tracts.
U.S. Census Tracts
The distribution is based on data from 82,720 U.S. census tracts.
Mendocino, CA County Value
(86.8%)
The regional value is compared to the Mendocino County value.
Trend
This comparison measures the indicator’s values over multiple time periods.<br>The Mann-Kendall Test for Statistical Significance is used to evaluate the trend<br>over 4 to 10 periods of measure, subject to data availability and comparability.
People 25+ with a High School Diploma or Higher Census Tract: 06045010801
People 25+ with a High School Diploma or Higher Census Tract: 06045010801
90.2%
(2018-2022)
Compared to:
CA Census Tracts
The distribution is based on data from 9,076 California census tracts.
U.S. Census Tracts
The distribution is based on data from 82,720 U.S. census tracts.
Mendocino, CA County Value
(86.8%)
The regional value is compared to the Mendocino County value.
Trend
This comparison measures the indicator’s values over multiple time periods.<br>The Mann-Kendall Test for Statistical Significance is used to evaluate the trend<br>over 4 to 10 periods of measure, subject to data availability and comparability.
People 25+ with a High School Diploma or Higher Census Tract: 06045010802
People 25+ with a High School Diploma or Higher Census Tract: 06045010802
96.6%
(2018-2022)
Compared to:
CA Census Tracts
The distribution is based on data from 9,076 California census tracts.
U.S. Census Tracts
The distribution is based on data from 82,720 U.S. census tracts.
Mendocino, CA County Value
(86.8%)
The regional value is compared to the Mendocino County value.
Trend
This comparison measures the indicator’s values over multiple time periods.<br>The Mann-Kendall Test for Statistical Significance is used to evaluate the trend<br>over 4 to 10 periods of measure, subject to data availability and comparability.
People 25+ with a High School Diploma or Higher Census Tract: 06045010900
People 25+ with a High School Diploma or Higher Census Tract: 06045010900
78.1%
(2018-2022)
Compared to:
CA Census Tracts
The distribution is based on data from 9,076 California census tracts.
U.S. Census Tracts
The distribution is based on data from 82,720 U.S. census tracts.
Mendocino, CA County Value
(86.8%)
The regional value is compared to the Mendocino County value.
Trend
This comparison measures the indicator’s values over multiple time periods.<br>The Mann-Kendall Test for Statistical Significance is used to evaluate the trend<br>over 4 to 10 periods of measure, subject to data availability and comparability.
People 25+ with a High School Diploma or Higher Census Tract: 06045011001
People 25+ with a High School Diploma or Higher Census Tract: 06045011001
96.2%
(2018-2022)
Compared to:
CA Census Tracts
The distribution is based on data from 9,076 California census tracts.
U.S. Census Tracts
The distribution is based on data from 82,720 U.S. census tracts.
Mendocino, CA County Value
(86.8%)
The regional value is compared to the Mendocino County value.
Trend
This comparison measures the indicator’s values over multiple time periods.<br>The Mann-Kendall Test for Statistical Significance is used to evaluate the trend<br>over 4 to 10 periods of measure, subject to data availability and comparability.
People 25+ with a High School Diploma or Higher Census Tract: 06045011002
People 25+ with a High School Diploma or Higher Census Tract: 06045011002
93.0%
(2015-2019)
Compared to:
CA Census Tracts
The distribution is based on data from 8,009 California census tracts.
U.S. Census Tracts
The distribution is based on data from 72,386 U.S. census tracts.
Mendocino, CA County Value
(86.5%)
The regional value is compared to the Mendocino County value.
People 25+ with a High School Diploma or Higher Census Tract: 06045011003
People 25+ with a High School Diploma or Higher Census Tract: 06045011003
93.7%
(2018-2022)
Compared to:
CA Census Tracts
The distribution is based on data from 9,076 California census tracts.
U.S. Census Tracts
The distribution is based on data from 82,720 U.S. census tracts.
Mendocino, CA County Value
(86.8%)
The regional value is compared to the Mendocino County value.
People 25+ with a High School Diploma or Higher Census Tract: 06045011004
People 25+ with a High School Diploma or Higher Census Tract: 06045011004
94.5%
(2018-2022)
Compared to:
CA Census Tracts
The distribution is based on data from 9,076 California census tracts.
U.S. Census Tracts
The distribution is based on data from 82,720 U.S. census tracts.
Mendocino, CA County Value
(86.8%)
The regional value is compared to the Mendocino County value.
People 25+ with a High School Diploma or Higher Census Tract: 06045011102
People 25+ with a High School Diploma or Higher Census Tract: 06045011102
89.4%
(2018-2022)
Compared to:
CA Census Tracts
The distribution is based on data from 9,076 California census tracts.
U.S. Census Tracts
The distribution is based on data from 82,720 U.S. census tracts.
Mendocino, CA County Value
(86.8%)
The regional value is compared to the Mendocino County value.
Trend
This comparison measures the indicator’s values over multiple time periods.<br>The Mann-Kendall Test for Statistical Significance is used to evaluate the trend<br>over 4 to 10 periods of measure, subject to data availability and comparability.
People 25+ with a High School Diploma or Higher Census Tract: 06045011200
People 25+ with a High School Diploma or Higher Census Tract: 06045011200
87.7%
(2018-2022)
Compared to:
CA Census Tracts
The distribution is based on data from 9,076 California census tracts.
U.S. Census Tracts
The distribution is based on data from 82,720 U.S. census tracts.
Mendocino, CA County Value
(86.8%)
The regional value is compared to the Mendocino County value.
Trend
This comparison measures the indicator’s values over multiple time periods.<br>The Mann-Kendall Test for Statistical Significance is used to evaluate the trend<br>over 4 to 10 periods of measure, subject to data availability and comparability.
People 25+ with a High School Diploma or Higher Census Tract: 06045011300
People 25+ with a High School Diploma or Higher Census Tract: 06045011300
80.7%
(2018-2022)
Compared to:
CA Census Tracts
The distribution is based on data from 9,076 California census tracts.
U.S. Census Tracts
The distribution is based on data from 82,720 U.S. census tracts.
Mendocino, CA County Value
(86.8%)
The regional value is compared to the Mendocino County value.
Trend
This comparison measures the indicator’s values over multiple time periods.<br>The Mann-Kendall Test for Statistical Significance is used to evaluate the trend<br>over 4 to 10 periods of measure, subject to data availability and comparability.
People 25+ with a High School Diploma or Higher Census Tract: 06045011400
People 25+ with a High School Diploma or Higher Census Tract: 06045011400
90.5%
(2018-2022)
Compared to:
CA Census Tracts
The distribution is based on data from 9,076 California census tracts.
U.S. Census Tracts
The distribution is based on data from 82,720 U.S. census tracts.
Mendocino, CA County Value
(86.8%)
The regional value is compared to the Mendocino County value.
Trend
This comparison measures the indicator’s values over multiple time periods.<br>The Mann-Kendall Test for Statistical Significance is used to evaluate the trend<br>over 4 to 10 periods of measure, subject to data availability and comparability.
People 25+ with a High School Diploma or Higher Census Tract: 06045011500
People 25+ with a High School Diploma or Higher Census Tract: 06045011500
76.0%
(2015-2019)
Compared to:
CA Census Tracts
The distribution is based on data from 8,009 California census tracts.
U.S. Census Tracts
The distribution is based on data from 72,386 U.S. census tracts.
Mendocino, CA County Value
(86.5%)
The regional value is compared to the Mendocino County value.
People 25+ with a High School Diploma or Higher Census Tract: 06045011501
People 25+ with a High School Diploma or Higher Census Tract: 06045011501
90.0%
(2018-2022)
Compared to:
CA Census Tracts
The distribution is based on data from 9,076 California census tracts.
U.S. Census Tracts
The distribution is based on data from 82,720 U.S. census tracts.
Mendocino, CA County Value
(86.8%)
The regional value is compared to the Mendocino County value.
People 25+ with a High School Diploma or Higher Census Tract: 06045011502
People 25+ with a High School Diploma or Higher Census Tract: 06045011502
72.5%
(2018-2022)
Compared to:
CA Census Tracts
The distribution is based on data from 9,076 California census tracts.
U.S. Census Tracts
The distribution is based on data from 82,720 U.S. census tracts.
Mendocino, CA County Value
(86.8%)
The regional value is compared to the Mendocino County value.
People 25+ with a High School Diploma or Higher Census Tract: 06045011600
People 25+ with a High School Diploma or Higher Census Tract: 06045011600
80.6%
(2018-2022)
Compared to:
CA Census Tracts
The distribution is based on data from 9,076 California census tracts.
U.S. Census Tracts
The distribution is based on data from 82,720 U.S. census tracts.
Mendocino, CA County Value
(86.8%)
The regional value is compared to the Mendocino County value.
Trend
This comparison measures the indicator’s values over multiple time periods.<br>The Mann-Kendall Test for Statistical Significance is used to evaluate the trend<br>over 4 to 10 periods of measure, subject to data availability and comparability.
People 25+ with a High School Diploma or Higher Census Tract: 06045011700
People 25+ with a High School Diploma or Higher Census Tract: 06045011700
93.8%
(2018-2022)
Compared to:
CA Census Tracts
The distribution is based on data from 9,076 California census tracts.
U.S. Census Tracts
The distribution is based on data from 82,720 U.S. census tracts.
Mendocino, CA County Value
(86.8%)
The regional value is compared to the Mendocino County value.
Trend
This comparison measures the indicator’s values over multiple time periods.<br>The Mann-Kendall Test for Statistical Significance is used to evaluate the trend<br>over 4 to 10 periods of measure, subject to data availability and comparability.
People 25+ with a High School Diploma or Higher Census Tract: 06045011800
People 25+ with a High School Diploma or Higher Census Tract: 06045011800
72.4%
(2018-2022)
Compared to:
CA Census Tracts
The distribution is based on data from 9,076 California census tracts.
U.S. Census Tracts
The distribution is based on data from 82,720 U.S. census tracts.
Mendocino, CA County Value
(86.8%)
The regional value is compared to the Mendocino County value.
Trend
This comparison measures the indicator’s values over multiple time periods.<br>The Mann-Kendall Test for Statistical Significance is used to evaluate the trend<br>over 4 to 10 periods of measure, subject to data availability and comparability.
Education / School Environment
Student-to-Teacher Ratio County: Mendocino
Student-to-Teacher Ratio County: Mendocino
18.1
Students per teacher
(2022-2023)
Compared to:

CA Counties
The distribution is based on data from 58 California counties.
U.S. Counties
The distribution is based on data from 3,125 U.S. counties and county equivalents.
CA Value
(21.9)
The regional value is compared to the California state value.
US Value
(15.4)
The regional value is compared to the national value.
Prior Value
(18.5)
Prior Value compares a measured value with the previously measured value. Confidence intervals were not taken into account in determining the direction of the comparison.
Trend
This comparison measures the indicator’s values over multiple time periods.<br>The Mann-Kendall Test for Statistical Significance is used to evaluate the trend<br>over 4 to 10 periods of measure, subject to data availability and comparability.
Education / Student Performance K-12
Education / Student Performance K-12
11th Grade Students Proficient in English/Language Arts
Value
Compared to:
11th Grade Students Proficient in English/Language Arts County: Mendocino
11th Grade Students Proficient in English/Language Arts County: Mendocino
41.5%
(2022)
Compared to:

CA Counties
The distribution is based on data from 57 California counties.
CA Value
(54.8%)
The regional value is compared to the California state value.
Prior Value
(55.6%)
Prior Value compares a measured value with the previously measured value. Confidence intervals were not taken into account in determining the direction of the comparison.
Trend
This comparison measures the indicator’s values over multiple time periods.<br>The Mann-Kendall Test for Statistical Significance is used to evaluate the trend<br>over 4 to 10 periods of measure, subject to data availability and comparability.
11th Grade Students Proficient in Math County: Mendocino
11th Grade Students Proficient in Math County: Mendocino
16.5%
(2022)
Compared to:
CA Counties
The distribution is based on data from 57 California counties.
CA Value
(27.0%)
The regional value is compared to the California state value.
Prior Value
(22.3%)
Prior Value compares a measured value with the previously measured value. Confidence intervals were not taken into account in determining the direction of the comparison.
Trend
This comparison measures the indicator’s values over multiple time periods.<br>The Mann-Kendall Test for Statistical Significance is used to evaluate the trend<br>over 4 to 10 periods of measure, subject to data availability and comparability.
Education / Student Performance K-12
3rd Grade Students Proficient in English/Language Arts
Value
Compared to:
3rd Grade Students Proficient in English/Language Arts County: Mendocino
3rd Grade Students Proficient in English/Language Arts County: Mendocino
26%
(2022)
Compared to:
CA Counties
The distribution is based on data from 57 California counties.
CA Value
(42%)
The regional value is compared to the California state value.
Prior Value
(35%)
Prior Value compares a measured value with the previously measured value. Confidence intervals were not taken into account in determining the direction of the comparison.
Trend
This comparison measures the indicator’s values over multiple time periods.<br>The Mann-Kendall Test for Statistical Significance is used to evaluate the trend<br>over 4 to 10 periods of measure, subject to data availability and comparability.
3rd Grade Students Proficient in Math County: Mendocino
3rd Grade Students Proficient in Math County: Mendocino
29%
(2022)
Compared to:
CA Counties
The distribution is based on data from 57 California counties.
CA Value
(44%)
The regional value is compared to the California state value.
Prior Value
(26%)
Prior Value compares a measured value with the previously measured value. Confidence intervals were not taken into account in determining the direction of the comparison.
Trend
This comparison measures the indicator’s values over multiple time periods.<br>The Mann-Kendall Test for Statistical Significance is used to evaluate the trend<br>over 4 to 10 periods of measure, subject to data availability and comparability.
Education / Student Performance K-12
4th Grade Students Proficient in English/Language Arts
Value
Compared to:
4th Grade Students Proficient in English/Language Arts County: Mendocino
4th Grade Students Proficient in English/Language Arts County: Mendocino
29%
(2022)
Compared to:
CA Counties
The distribution is based on data from 57 California counties.
CA Value
(44%)
The regional value is compared to the California state value.
Prior Value
(35%)
Prior Value compares a measured value with the previously measured value. Confidence intervals were not taken into account in determining the direction of the comparison.
Trend
This comparison measures the indicator’s values over multiple time periods.<br>The Mann-Kendall Test for Statistical Significance is used to evaluate the trend<br>over 4 to 10 periods of measure, subject to data availability and comparability.
4th Grade Students Proficient in Math County: Mendocino
4th Grade Students Proficient in Math County: Mendocino
24%
(2022)
Compared to:
CA Counties
The distribution is based on data from 57 California counties.
CA Value
(38%)
The regional value is compared to the California state value.
Prior Value
(32%)
Prior Value compares a measured value with the previously measured value. Confidence intervals were not taken into account in determining the direction of the comparison.
Trend
This comparison measures the indicator’s values over multiple time periods.<br>The Mann-Kendall Test for Statistical Significance is used to evaluate the trend<br>over 4 to 10 periods of measure, subject to data availability and comparability.
Education / Student Performance K-12
5th Grade Students Proficient in English/Language Arts
Value
Compared to:
5th Grade Students Proficient in English/Language Arts County: Mendocino
5th Grade Students Proficient in English/Language Arts County: Mendocino
28.3%
(2022)
Compared to:
CA Counties
The distribution is based on data from 57 California counties.
CA Value
(47.1%)
The regional value is compared to the California state value.
Prior Value
(33.9%)
Prior Value compares a measured value with the previously measured value. Confidence intervals were not taken into account in determining the direction of the comparison.
Trend
This comparison measures the indicator’s values over multiple time periods.<br>The Mann-Kendall Test for Statistical Significance is used to evaluate the trend<br>over 4 to 10 periods of measure, subject to data availability and comparability.
5th Grade Students Proficient in Math County: Mendocino
5th Grade Students Proficient in Math County: Mendocino
16.8%
(2022)
Compared to:
CA Counties
The distribution is based on data from 57 California counties.
CA Value
(31.6%)
The regional value is compared to the California state value.
Prior Value
(11.9%)
Prior Value compares a measured value with the previously measured value. Confidence intervals were not taken into account in determining the direction of the comparison.
Trend
This comparison measures the indicator’s values over multiple time periods.<br>The Mann-Kendall Test for Statistical Significance is used to evaluate the trend<br>over 4 to 10 periods of measure, subject to data availability and comparability.
Education / Student Performance K-12
6th Grade Students Proficient in English/Language Arts
Value
Compared to:
6th Grade Students Proficient in English/Language Arts County: Mendocino
6th Grade Students Proficient in English/Language Arts County: Mendocino
31.1%
(2022)
Compared to:
CA Counties
The distribution is based on data from 57 California counties.
CA Value
(45.1%)
The regional value is compared to the California state value.
Prior Value
(19.1%)
Prior Value compares a measured value with the previously measured value. Confidence intervals were not taken into account in determining the direction of the comparison.
Trend
This comparison measures the indicator’s values over multiple time periods.<br>The Mann-Kendall Test for Statistical Significance is used to evaluate the trend<br>over 4 to 10 periods of measure, subject to data availability and comparability.
6th Grade Students Proficient in Math County: Mendocino
6th Grade Students Proficient in Math County: Mendocino
18.2%
(2022)
Compared to:
CA Counties
The distribution is based on data from 57 California counties.
CA Value
(32.5%)
The regional value is compared to the California state value.
Prior Value
(9.7%)
Prior Value compares a measured value with the previously measured value. Confidence intervals were not taken into account in determining the direction of the comparison.
Trend
This comparison measures the indicator’s values over multiple time periods.<br>The Mann-Kendall Test for Statistical Significance is used to evaluate the trend<br>over 4 to 10 periods of measure, subject to data availability and comparability.
Education / Student Performance K-12
7th Grade Students Proficient in English/Language Arts
Value
Compared to:
7th Grade Students Proficient in English/Language Arts County: Mendocino
7th Grade Students Proficient in English/Language Arts County: Mendocino
35.9%
(2022)
Compared to:
CA Counties
The distribution is based on data from 57 California counties.
CA Value
(49.2%)
The regional value is compared to the California state value.
Prior Value
(33.5%)
Prior Value compares a measured value with the previously measured value. Confidence intervals were not taken into account in determining the direction of the comparison.
Trend
This comparison measures the indicator’s values over multiple time periods.<br>The Mann-Kendall Test for Statistical Significance is used to evaluate the trend<br>over 4 to 10 periods of measure, subject to data availability and comparability.
7th Grade Students Proficient in Math County: Mendocino
7th Grade Students Proficient in Math County: Mendocino
19.4%
(2022)
Compared to:
CA Counties
The distribution is based on data from 57 California counties.
CA Value
(32.0%)
The regional value is compared to the California state value.
Prior Value
(15.1%)
Prior Value compares a measured value with the previously measured value. Confidence intervals were not taken into account in determining the direction of the comparison.
Trend
This comparison measures the indicator’s values over multiple time periods.<br>The Mann-Kendall Test for Statistical Significance is used to evaluate the trend<br>over 4 to 10 periods of measure, subject to data availability and comparability.
Education / Student Performance K-12
8th Grade Students Proficient in English/Language Arts
Value
Compared to:
8th Grade Students Proficient in English/Language Arts County: Mendocino
8th Grade Students Proficient in English/Language Arts County: Mendocino
30.6%
(2022)
Compared to:
CA Counties
The distribution is based on data from 57 California counties.
CA Value
(46.6%)
The regional value is compared to the California state value.
Prior Value
(30.5%)
Prior Value compares a measured value with the previously measured value. Confidence intervals were not taken into account in determining the direction of the comparison.
Trend
This comparison measures the indicator’s values over multiple time periods.<br>The Mann-Kendall Test for Statistical Significance is used to evaluate the trend<br>over 4 to 10 periods of measure, subject to data availability and comparability.
8th Grade Students Proficient in Math County: Mendocino
8th Grade Students Proficient in Math County: Mendocino
15.4%
(2022)
Compared to:
CA Counties
The distribution is based on data from 57 California counties.
CA Value
(29.2%)
The regional value is compared to the California state value.
Prior Value
(13.2%)
Prior Value compares a measured value with the previously measured value. Confidence intervals were not taken into account in determining the direction of the comparison.
Trend
This comparison measures the indicator’s values over multiple time periods.<br>The Mann-Kendall Test for Statistical Significance is used to evaluate the trend<br>over 4 to 10 periods of measure, subject to data availability and comparability.
High School Graduation County: Mendocino
High School Graduation County: Mendocino
87.4%
(2022-2023)
Compared to:
CA Counties
The distribution is based on data from 57 California counties.
CA Value
(86.2%)
The regional value is compared to the California state value.
US Value
(86.5% in 2020)
The regional value is compared to the national value. The source for the national value is National Center for Education Statistics
Prior Value
(84.0%)
Prior Value compares a measured value with the previously measured value. Confidence intervals were not taken into account in determining the direction of the comparison.
Trend
This comparison measures the indicator’s values over multiple time periods.<br>The Mann-Kendall Test for Statistical Significance is used to evaluate the trend<br>over 4 to 10 periods of measure, subject to data availability and comparability.
HP 2030 Target
(90.7%)
Environmental Health / Air
Annual Ozone Air Quality County: Mendocino
Annual Ozone Air Quality County: Mendocino
1
(2019-2021)
Compared to:
Air Quality Index
The American Lung Association (ALA) assigns grades A-F to counties (A=1; B=2; C=3; D=4; F=5), based on average annual number of days that ozone levels exceeded U.S. standards during the three year measurement period. The five-point grading scale was used for the distribution (Green = <2; Yellow = 2 - 3; Red = >3). The air quality data is collected by the EPA and summarized by the ALA.
Prior Value
(1)
Prior Value compares a measured value with the previously measured value. Confidence intervals were not taken into account in determining the direction of the comparison.
Trend
This comparison measures the indicator’s values over multiple time periods.<br>The Mann-Kendall Test for Statistical Significance is used to evaluate the trend<br>over 4 to 10 periods of measure, subject to data availability and comparability.
Annual Particle Pollution County: Mendocino
Annual Particle Pollution County: Mendocino
5
(2019-2021)
Compared to:

Air Quality Index
The American Lung Association (ALA) assigns grades A-F to counties (A=1; B=2; C=3; D=4; F=5), based on average annual number of days that particle pollution levels exceeded U.S. standards during the three year measurement period. The five-point grading scale was used for the distribution (Green = <2; Yellow = 2 - 3; Red = >3). The air quality data is collected by the EPA and summarized by the ALA.
Prior Value
(5)
Prior Value compares a measured value with the previously measured value. Confidence intervals were not taken into account in determining the direction of the comparison.
Trend
This comparison measures the indicator’s values over multiple time periods.<br>The Mann-Kendall Test for Statistical Significance is used to evaluate the trend<br>over 4 to 10 periods of measure, subject to data availability and comparability.
Environmental Health / Built Environment
Access to Exercise Opportunities County: Mendocino
Access to Exercise Opportunities County: Mendocino
66.7%
(2024)
Compared to:
CA Counties
The distribution is based on data from 58 California counties.
U.S. Counties
The distribution is based on data from 3,096 U.S. counties and county equivalents.
CA Value
(94.2%)
The regional value is compared to the California state value.
US Value
(84.1%)
The regional value is compared to the national value.
Prior Value
(65.9%)
Prior Value compares a measured value with the previously measured value. Confidence intervals were not taken into account in determining the direction of the comparison.
Access to Parks County: Mendocino
Access to Parks County: Mendocino
45.4%
(2020)
Compared to:
CA Counties
The distribution is based on data from 58 California counties.
CA Value
(82.4%)
The regional value is compared to the California state value.
Prior Value
(42.1%)
Prior Value compares a measured value with the previously measured value. Confidence intervals were not taken into account in determining the direction of the comparison.
Food Environment Index County: Mendocino
Food Environment Index County: Mendocino
7.5
(2024)
Compared to:
CA Counties
The distribution is based on data from 58 California counties.
U.S. Counties
The distribution is based on data from 3,108 U.S. counties and county equivalents.
CA Value
(8.6)
The regional value is compared to the California state value.
US Value
(7.7)
The regional value is compared to the national value.
Prior Value
(7.4)
Prior Value compares a measured value with the previously measured value. Confidence intervals were not taken into account in determining the direction of the comparison.
Trend
This comparison measures the indicator’s values over multiple time periods.<br>The Mann-Kendall Test for Statistical Significance is used to evaluate the trend<br>over 4 to 10 periods of measure, subject to data availability and comparability.
Liquor Store Density County: Mendocino
Liquor Store Density County: Mendocino
8.8
Stores per 100,000 population
(2021)
Compared to:
CA Counties
The distribution is based on data from 44 California counties.
U.S. Counties
The distribution is based on data from 1,477 U.S. counties and county equivalents.
CA Value
(11.0)
The regional value is compared to the California state value.
US Value
(10.7)
The regional value is compared to the national value.
Prior Value
(8.8)
Prior Value compares a measured value with the previously measured value. Confidence intervals were not taken into account in determining the direction of the comparison.
Trend
This comparison measures the indicator’s values over multiple time periods.<br>The Mann-Kendall Test for Statistical Significance is used to evaluate the trend<br>over 4 to 10 periods of measure, subject to data availability and comparability.
Proximity to Highways County: Mendocino
Proximity to Highways County: Mendocino
2.7%
(2020)
Compared to:
CA Counties
The distribution is based on data from 58 California counties.
CA Value
(6.6%)
The regional value is compared to the California state value.
Prior Value
(3.3%)
Prior Value compares a measured value with the previously measured value. Confidence intervals were not taken into account in determining the direction of the comparison.
Environmental Health / Weather & Climate
Daily Dose of UV Irradiance County: Mendocino
Daily Dose of UV Irradiance County: Mendocino
4,477.0
Joule per square meter
(2020)
Compared to:

CA Counties
The distribution is based on data from 58 California counties.
CA Value
(4,541.0)
The regional value is compared to the California state value.
Prior Value
(4,114.0)
Prior Value compares a measured value with the previously measured value. Confidence intervals were not taken into account in determining the direction of the comparison.
Trend
This comparison measures the indicator’s values over multiple time periods.<br>The Mann-Kendall Test for Statistical Significance is used to evaluate the trend<br>over 4 to 10 periods of measure, subject to data availability and comparability.
Number of Extreme Heat Days County: Mendocino
Number of Extreme Heat Days County: Mendocino
32
Days
(2021)
Compared to:

Prior Value
(29)
Prior Value compares a measured value with the previously measured value. Confidence intervals were not taken into account in determining the direction of the comparison.
Trend
This comparison measures the indicator’s values over multiple time periods.<br>The Mann-Kendall Test for Statistical Significance is used to evaluate the trend<br>over 4 to 10 periods of measure, subject to data availability and comparability.
Number of Extreme Heat Events County: Mendocino
Number of Extreme Heat Events County: Mendocino
25
Events
(2021)
Compared to:
Prior Value
(25)
Prior Value compares a measured value with the previously measured value. Confidence intervals were not taken into account in determining the direction of the comparison.
Trend
This comparison measures the indicator’s values over multiple time periods.<br>The Mann-Kendall Test for Statistical Significance is used to evaluate the trend<br>over 4 to 10 periods of measure, subject to data availability and comparability.
Number of Extreme Precipitation Days County: Mendocino
Number of Extreme Precipitation Days County: Mendocino
11
Days
(2021)
Compared to:
Prior Value
(1)
Prior Value compares a measured value with the previously measured value. Confidence intervals were not taken into account in determining the direction of the comparison.
Trend
This comparison measures the indicator’s values over multiple time periods.<br>The Mann-Kendall Test for Statistical Significance is used to evaluate the trend<br>over 4 to 10 periods of measure, subject to data availability and comparability.
Weeks of Moderate Drought or Worse County: Mendocino
Weeks of Moderate Drought or Worse County: Mendocino
47
Weeks per year
(2021)
Compared to:
Prior Value
(43)
Prior Value compares a measured value with the previously measured value. Confidence intervals were not taken into account in determining the direction of the comparison.
Trend
This comparison measures the indicator’s values over multiple time periods.<br>The Mann-Kendall Test for Statistical Significance is used to evaluate the trend<br>over 4 to 10 periods of measure, subject to data availability and comparability.
